This post is a test to see if I can use the HTML5 Canvas and JavaScript within a Blogger post.
If you see a circle below, it worked. :)
It worked for me, in preview. I used some very simple examples from the w3schools.com HTML5 Canvas page. I'm going to have to consider doing the Shapes series I was working on as HTML5 Canvas + JavaScript rather than the C# I was originally working on, so people can play with it interactively.

This blog covers my adventures in reading, writing, procedural content generation, and whatever else comes to mind.
Showing posts with label programming. Show all posts
Showing posts with label programming. Show all posts
Tuesday, November 28, 2017
Saturday, November 18, 2017
JavaScript fun for 3D
Yesterday I wrote about a few of the JavaScript libraries I found that would help solve some needs at Day Job (tm). Today I'll mention another one I played with yesterday evening that may be of some interest. I'd heard of three.js before, as it was used in the web-based planet generator I've mentioned in the past, but this was the first time I really looked at in depth.
three.js is a JavaScript library for loading, displaying, and interacting with 3D graphics inside a web browser. WebGL was introduced as a web version of the venerable OpenGL technology years ago, but OpenGL (and, by extension, WebGL) are very low level. three.js provides a higher-level interface, with support for loading models in various formats. The website offers a multitude of example web pages with working examples. It even has a few examples using fractal methods to generate a terrain that can be moved around in.
Alas, there aren't built-in loaders for the formats I need for Day Job (tm), but that's simply a matter of writing a compatible loader, or a separate converter program to take models in the formats we have them in and convert them to formats three.js can load.
Beyond work, though, it has the potential to be useful as the display end for some of the other things I've been experimenting with for fun. I wouldn't want to write the code to generate things in JavaScript, but a web page using three.js to display the results would be entirely feasible.
Surprisingly, three.js even offers a web-based 3D scene editor. It isn't Blender, SketchUp, 3D Max, or AutoCAD, and there's no real mesh modeling support, only primitives like box, sphere, cylinder, torus, etc. Nevertheless, it can be used to create a 3D scene relatively easily, and does have import capabilities so that models in other formats, like OBJ, can be imported. It can export to OBJ, STL, and its own JSON-based format. It can even publish scenes and a web page to view the scene. Pretty slick.
Anyhow, if you need 3D on your web page, this is worth checking out.
Friday, November 17, 2017
Useful JavaScript and More
My Day Job has been keeping me rather busy the last few days, so I haven't had a chance to wrap up the series of Shapes posts I was working on. Instead, I'll give a quick shout out to a few useful bits of JavaScript I've done a little experimentation with for Day Job.
First off, there's jsTree. jsTree is JavaScript for a tree-like user control. It can be created and manipulated via script, or the script can be applied to a set of nested HTML lists or JSON data to "tree-ify" it. For what I was prototyping, it took less than ten minutes to read the jsTree documentation, mock something up in an HTML file, and then apply the jsTree script to turn it into an interactive tree. A stylesheet reference, two script references, and about eight lines of JavaScript was all it took. Pretty sweet.
Second, there's the svg-pan-zoom script. A single script reference and about six lines of JavaScript allowed me to take a large SVG diagram that was loaded onto a web page and make it possible to pan and zoom. It was a very large diagram with many fine details. Before the pan and zoom script was applied, the fine details were illegible. With the script, it was easy to zoom in and navigate in the diagram. It took me just a bit longer to get this working right, perhaps twenty minutes.
And third, we have ViewerJS. ViewerJS offers the ability to easily view PDF and LibreOffice/OpenOffice files on a website, without the need for plugins or any special executable code to be placed on the server - its all pure JavaScript. This took me about twenty minutes to figure out the basics. Since many of you have files in Microsoft Office format, I should mention that LibreOffice can be run at command line, and scripted, to convert one or many files to formats ViewerJS supports.
The developers of these components have done an excellent job development, packaging, and providing useful demos and examples. Nice work! All three are also open source software.
And finally, not JavaScript, but icons. Google has a source of 900+ icons as part of its Material Design effort. There initial Google icons plus a whole bunch more can also be found at the Material Design Icons web site. I'm using a good number of them with the experiment; I just wish more of them were a good fit for the domain the program relates to.
Tuesday, November 14, 2017
Thickening with Falloff
Yesterday I was looking for a way to generate decreasing intensity extending outward from initial shapes. It is something that may be useful for some other techniques going forward, though is of some limited use in and of itself, and the effect itself is somewhat interesting. It might look nicer with some smoothing, though.
Here's a more : Given a raster representation of some initial geometry, this program calculates distance of pixels from the initial geometry, then visually represents the distance as a gradient between white (initial geometry) and black (at and beyond threshold).
The program has two required command line arguments (input and output files) and an optional argument specifying the threshold in pixels. Here's an example of the arguments I was using:
In the input image, black is treated as no geometry, any other color counts as geometry.
I'm releasing the C# source code under the MIT license, with no warranty. Use at own risk. Since I used the Vector2 struct you'll need to add the System.Numerics.Vectors package (which can be done with Install-Package System.Numerics.Vectors -Version 4.4.0 from the Package Manager Console in Visual Studio) or substitute your own implementation of Vector2.
Here's a more : Given a raster representation of some initial geometry, this program calculates distance of pixels from the initial geometry, then visually represents the distance as a gradient between white (initial geometry) and black (at and beyond threshold).
The program has two required command line arguments (input and output files) and an optional argument specifying the threshold in pixels. Here's an example of the arguments I was using:
Thicken.exe -in C:\test\input.png -out C:\test\output.png -threshold 48
In the input image, black is treated as no geometry, any other color counts as geometry.
 |
| Input was a 512 x 512 PNG file |
 |
| Output image with a 48 pixel falloff threshold |
I'm releasing the C# source code under the MIT license, with no warranty. Use at own risk. Since I used the Vector2 struct you'll need to add the System.Numerics.Vectors package (which can be done with Install-Package System.Numerics.Vectors -Version 4.4.0 from the Package Manager Console in Visual Studio) or substitute your own implementation of Vector2.
using System;
using System.Collections.Generic;
using System.Drawing;
using System.Linq;
using System.Numerics;
using System.Text;
using System.Threading.Tasks;

namespace Thickening
{
    class Program
    {
        private static void ReadImageAsMap(string fileName, out int[] map,
            out int width, out int height)
        {
            // Read input image into map array.  Any non-black pixel is a starting point.
            Bitmap inputImage = (Bitmap)Bitmap.FromFile(fileName);
            width = inputImage.Width;
            height = inputImage.Height;
            map = new int[width * height];
            for (int y = 0; y < height; y++)
            {
                for (int x = 0; x < width; x++)
                {
                    int i = y * width + x;
                    Color c = inputImage.GetPixel(x, y);
                    if (c.R > 0 || c.G > 0 || c.B > 0)
                    {
                        map[i] = 0;
                    }
                    else
                    {
                        map[i] = -1;
                    }
                }
            }
        }

        private static void Thicken(int[] map, int width, int height)
        {
            // Find starting points (zero).
            List<Vector2> current = new List<Vector2>();
            for (int y = 0; y < height; y++)
            {
                for (int x = 0; x < width; x++)
                {
                    int i = y * width + x;
                    if (map[i] == 0)
                        current.Add(new Vector2(x, y));
                }
            }

            // Iterative set distance around starting points or points
            // where distance has already been calculated.
            while (current.Count > 0)
            {
                List<Vector2> next = new List<Vector2>();
                foreach (var curr in current)
                {
                    int cx = (int)curr.X;
                    int cy = (int)curr.Y;
                    int val = map[cy * width + cx];

                    // Look at neighbors.
                    for (int y = cy - 1; y <= cy + 1; y++)
                    {
                        if (y < 0 || y >= height) continue;
                        int ny = y;

                        for (int x = cx - 1; x <= cx + 1; x++)
                        {
                            int nx = x;
                            if (nx < 0) nx = width - 1;
                            else if (nx >= width) nx = 0;

                            int j = ny * width + nx;
                            int nval = map[j];

                            if (nval < 0)
                            {
                                Vector2 neighbor = new Vector2(nx, ny);
                                if (!current.Contains(neighbor)
                                    && !next.Contains(neighbor))
                                {
                                    map[j] = val + 1;
                                    next.Add(neighbor);
                                }
                            }
                        }
                    }

                }
                current = next;
            }
        }

        private static float Clamp(float min, float val, float max)
        {
            if (val < min) return min;
            if (val > max) return max;
            return val;
        }


        private static void WriteMapAsImage(string fileName, int[] map,
            int width, int height, float threshold)
        {
            Bitmap outputImage = new Bitmap(width, height,
                System.Drawing.Imaging.PixelFormat.Format32bppArgb);
            for (int y = 0; y < height; y++)
            {
                for (int x = 0; x < width; x++)
                {
                    int i = y * width + x;
                    int val = map[i];
                    Color c = Color.Black;
                    if (val >= 0)
                    {
                        // Calculate percentage closeness to initial geometry.
                        // Intensity is 100% at initial geometry,
                        // 0 % at or beyond threshold.
                        float closePercent = (threshold - val) / threshold;
                        closePercent = Clamp(0, closePercent, 1.0f);
                        int val2  = (int)(closePercent * 255.0);
                        c = Color.FromArgb(val2, val2, val2);
                    }
                    outputImage.SetPixel(x, y, c);
                }
            }
            outputImage.Save(fileName);
        }


        private static string ParseForArgumentValue(string[] args,
            string argumentName, bool caseInsensitive = true,
            string defaultValue = null)
        {
            if (args == null || args.Length == 0)
                return defaultValue;

            string prevArg = "";
            foreach (string arg in args)
            {
                bool isMatch = false;
                if (caseInsensitive)
                    isMatch = (prevArg.ToLower() == argumentName.ToLower());
                else
                    isMatch = (prevArg == argumentName);
                if (isMatch)
                    return arg;
                prevArg = arg;
            }
            return defaultValue;
        }


        static void Main(string[] args)
        {
            if (args == null || args.Length == 0)
            {
                string msg = "Thicken.exe -in input.png -out output.png [-threshold 32]";
                Console.Error.WriteLine(msg);
                Environment.Exit(1);
            }

            string input = ParseForArgumentValue(args, "-in", true, null);
            string output = ParseForArgumentValue(args, "-out", true, null);
            string thresholdString = ParseForArgumentValue(args, "-threshold", true, "32");
            int threshold = 32;
            bool thresholdOk = Int32.TryParse(thresholdString, out threshold);
            if (!thresholdOk)
            {
                string msg = "Invalid value for -threshold argument.  " +
                    "Omit -threshold argument or supply a valid positive integer " +
                    "less than two billion.";
                Console.Error.WriteLine(msg);
                Environment.Exit(2);
            }

            try
            {

                int width, height;
                int[] map;
                ReadImageAsMap(input, out map, out width, out height);
                Thicken(map, width, height);
                WriteMapAsImage(output, map, width, height, threshold);
            }
            catch (Exception ex)
            {
                Console.Error.WriteLine("Unexpected error: {0}", ex.ToString());
                Environment.Exit(3);
            }
        }
    }
}
Monday, November 13, 2017
Coming Soon: Shapes!
Coming in the near future shall be Shapes! Shapes is a (possibly) exciting tutorial series on some programming techniques that do interesting things with shapes. However, I've still got some more example code to finish, text to write up, screenshots to take, etc. to give it some polish. Expect something sometime next week. Until then, I leave with you with a few simple, not-particularly-exciting images that emerged from parts 1 and 2. (Yes, parts 3 and later are some
 |
| Example output from part 1 |
 |
| Example output from part 2 |
 |
| Example output from part 3 |
Thursday, February 9, 2017
Plate Tectonics - 13
I decided to take a brief break from wrapping up the Plat Tectonics simulator work to actually play with it and see about using the generated elevation data in other programs.
First off, I modified my C# port of Amit Patel's polygon map generator to support imported elevation data. There's still some incomplete features in this program, especially with my "Tolkien-esque" rendering mode. When using imported elevation data, sometimes the river networks have anomalies, caused by low spots - "dips" or "holes" - within continental interiors. This could be addressed either within the Plate Tectonics simulator or within the map program.
I've also implemented an import mode for the planet generator I've mentioned in posts past. For terrestrial planets, it usually uses 3D Perlin noise to create the elevation map of the world. With the import, it uses the imported elevation data instead of the noise.
 |
| Graphical output from Plate Tectonics simulator. Single-precision floating-point data is actually used for interchange. |
First off, I modified my C# port of Amit Patel's polygon map generator to support imported elevation data. There's still some incomplete features in this program, especially with my "Tolkien-esque" rendering mode. When using imported elevation data, sometimes the river networks have anomalies, caused by low spots - "dips" or "holes" - within continental interiors. This could be addressed either within the Plate Tectonics simulator or within the map program.
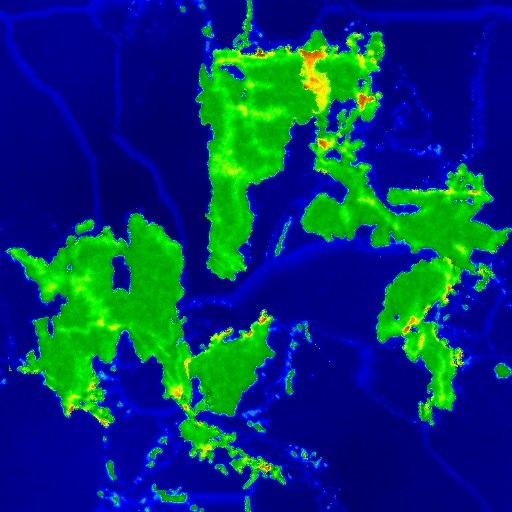
 |
| Elevation data from Plate Tectonics simulator was the data source for this image in a polygonal map generator. |
 |
| Close-up of the northwestern continent, in Biome view. |
 |
| Close-up of part of the map, in "Tolkien" view |
 |
| Map created from importing the elevation data into Planets program |
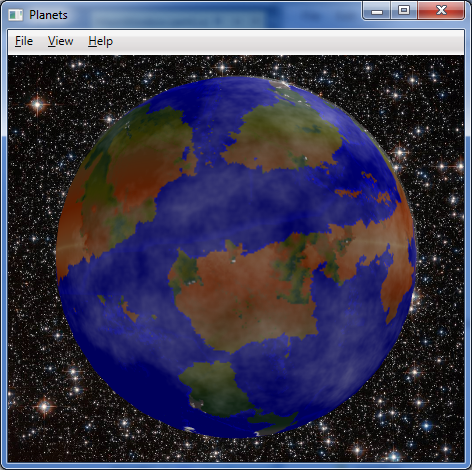 |
| The map wrapped around a globe, with some fractal clouds partially shrouding the planet. |
Wednesday, February 8, 2017
Plate Tectonics - 12
It is all over but the cleanup. The algorithms are all working about as I'd like. I understand the erosion algorithms a lot more now. The original version of PlaTec from several years ago used a modified image smoothing algorithm for erosion. The 2015 version incorporated, in sequence, a hydraulic erosion model (rain drop method), the adding of some random noise to the elevation, and then a super-simplified but effective approximation of thermal erosion. Run it too frequently, and the continent would erode away to sea level, but often in the interior before along the coasts.
Because of some of the abnormalities (the "caterpillars" and eroded mountains) and that tendency, I added a coastal erosion process that lessens the elevation of cells adjacent to water, and run the main erosion algorithm less frequently. I also increased the threshold for the main erosion algorithm, reducing over-erosion of the continental land masses.
About my only complaint is the high degree of variability in the "quality" of the results for a given set of parameters (other than the random number generator seed). The majority of results are acceptable, but some oddities can show up, and you never know if you'll get them or not. So this isn't greatly amenable to fully automated operation; a person should definitely review results for suitability.
So what's left before release? Just the cleanup. I have a variety of debug outputs that need to removed. There are a handful of functions that should ideally be made members of classes if possible - in one case, I'm not sure its possible due to how FLTK callbacks work. I guess I'll find out. I drastically increased the number of simulation parameters that were exposed. However, the export code only currently writes out the few parameters that were originally exposed. So that will need to be updated. I suppose it could also use a quick document describing the simulation parameters and how to accomplish different basic goals with them can be accomplished. Then to GitHub with the lot of it.
 |
| Example 1 |
Because of some of the abnormalities (the "caterpillars" and eroded mountains) and that tendency, I added a coastal erosion process that lessens the elevation of cells adjacent to water, and run the main erosion algorithm less frequently. I also increased the threshold for the main erosion algorithm, reducing over-erosion of the continental land masses.
 |
| Example 2 |
About my only complaint is the high degree of variability in the "quality" of the results for a given set of parameters (other than the random number generator seed). The majority of results are acceptable, but some oddities can show up, and you never know if you'll get them or not. So this isn't greatly amenable to fully automated operation; a person should definitely review results for suitability.
 |
| Example 3 |
So what's left before release? Just the cleanup. I have a variety of debug outputs that need to removed. There are a handful of functions that should ideally be made members of classes if possible - in one case, I'm not sure its possible due to how FLTK callbacks work. I guess I'll find out. I drastically increased the number of simulation parameters that were exposed. However, the export code only currently writes out the few parameters that were originally exposed. So that will need to be updated. I suppose it could also use a quick document describing the simulation parameters and how to accomplish different basic goals with them can be accomplished. Then to GitHub with the lot of it.
 |
| Parameters - these should all be written to file when exporting image or elevation data |
Sunday, February 5, 2017
Plate Tectonics - 11
Well, never mind then. I understand where the problems I'm running into with non-power-of-two dimensions comes from. It comes from the multitude of bit-wise operations that depend upon the width or height of the map being a power of two. One less than a power of two results in a "mask" with all the bits below the bit for that power being set to one. That is, if the value is 8, the binary is 1000, but if the value is 7, the binary is 0111. So a bit-wise AND operation of a coordinate and the length of a side of the map would result in a value that was always within the range of the map side's length - but only if the side (width or height) is a power of two. If the dimension was seven, the binary would be 0111, but binary for one less would be 0110. That screws things up.
The code is riddled with statements like
if (area[i].lft == ((lft + 1) & (map_width-1)))
and
size_t k = (y & (map_height - 1)) * map_width + (x & (map_width - 1));
They are short, terse, and computationally inexpensive, but they fail to work properly when the map_width and map_height values are not powers-of-two. I started to rewrite code to address it, and was making a little progress. Unfortunately the end product is several extra lines of code for each such instance, and involves more computationally expensive (costly) operations than a simple bit-wise AND and a subtraction operation. After 90 minutes of work, it was almost right in one function, as shown below.
But not quite right. And that was in only one function among several, and many of those functions made far heavier use of those AND operations. So I made up my mind. Rather then go through the many hundreds of lines of code that use such statements, and rewrite them into more computationally expensive (costly) operations and adding many news lines of and taking perhaps another dozen hours, I shall give up on non-power-of-two dimensions for this release. Maybe someday in the future. So no 1024x768 or 640x480 or 512x384 output for now, but 1024x1024, 1024x512, etc. should work just fine. I'll make some comments in the code, remove the non-power-of-two dimensions from the GUI, and move on.
Integration of parameters from the GUI into the simulation will likely be my last thing to accomplish before I release this, unless I uncover additional problems.
The code is riddled with statements like
if (area[i].lft == ((lft + 1) & (map_width-1)))
and
size_t k = (y & (map_height - 1)) * map_width + (x & (map_width - 1));
They are short, terse, and computationally inexpensive, but they fail to work properly when the map_width and map_height values are not powers-of-two. I started to rewrite code to address it, and was making a little progress. Unfortunately the end product is several extra lines of code for each such instance, and involves more computationally expensive (costly) operations than a simple bit-wise AND and a subtraction operation. After 90 minutes of work, it was almost right in one function, as shown below.
 |
| 512x384 map of the plates. Almost right, but still seeing red, which indicates plate is missing. 768x384 and 768x768 show similar problems. 512x256, 512x512, 512x1024, and 1024x256 maps do NOT. |
But not quite right. And that was in only one function among several, and many of those functions made far heavier use of those AND operations. So I made up my mind. Rather then go through the many hundreds of lines of code that use such statements, and rewrite them into more computationally expensive (costly) operations and adding many news lines of and taking perhaps another dozen hours, I shall give up on non-power-of-two dimensions for this release. Maybe someday in the future. So no 1024x768 or 640x480 or 512x384 output for now, but 1024x1024, 1024x512, etc. should work just fine. I'll make some comments in the code, remove the non-power-of-two dimensions from the GUI, and move on.
Integration of parameters from the GUI into the simulation will likely be my last thing to accomplish before I release this, unless I uncover additional problems.
Plate Tectonics - 10
It is well after midnight. My first approach at getting the erosion situation ("caterpillars" vs. worn-down mountains) resolved did not work nearly so well as I had hoped. Careful tuning was not enough. Either it was ineffective or it eroded land down to shoals.
So I decided upon a new approach. The erosion algorithm has been split into two. One is the "wave erosion" for coastal and island erosion. That's my very crude but rather effective method. The other part is the rain drop algorithm implemented by the original PlaTec developer, Lauri Viitanen. Wave erosion runs more frequently than the regular erosion. This is a fairly effective approach, although different parameters can yield different results.
I'm still not quite happy with this outcome. Some of the simulation parameters are still hard-coded constants. I have another few hours to go integrating all the parameters shown in the GUI as true parameters that can be passed into the main simulation class. The restart and aggregation overlap settings can really improve the compactness of the continental masses that form. Likewise, having the fractal parameters driven from the UI (or later, a settings file) will be quite nice - as it is, I currently have to make changes to hard coded constants. Ugh.
I was testing non-power-of-two dimensions for the map and discovered a problems. I can use whatever aspect ratio I want, but if any dimension is not an exact power of two (two raised to an integral positive power), problems ensue. I am currently debugging this, which yielded the colorful image below. Each of the grayscale rectangles represents the bounding box of a plate, while the red represents areas that plates have moved away from. Those lines? They represent an indicator that I have problems. So, either a bit more work, or forget about non-power-of-two dimensions for now.
 |
| Not cutting it |
So I decided upon a new approach. The erosion algorithm has been split into two. One is the "wave erosion" for coastal and island erosion. That's my very crude but rather effective method. The other part is the rain drop algorithm implemented by the original PlaTec developer, Lauri Viitanen. Wave erosion runs more frequently than the regular erosion. This is a fairly effective approach, although different parameters can yield different results.
 |
| Decent mountains, island chains, few "caterpillars" |
I'm still not quite happy with this outcome. Some of the simulation parameters are still hard-coded constants. I have another few hours to go integrating all the parameters shown in the GUI as true parameters that can be passed into the main simulation class. The restart and aggregation overlap settings can really improve the compactness of the continental masses that form. Likewise, having the fractal parameters driven from the UI (or later, a settings file) will be quite nice - as it is, I currently have to make changes to hard coded constants. Ugh.
 |
| Parameters organized |
I was testing non-power-of-two dimensions for the map and discovered a problems. I can use whatever aspect ratio I want, but if any dimension is not an exact power of two (two raised to an integral positive power), problems ensue. I am currently debugging this, which yielded the colorful image below. Each of the grayscale rectangles represents the bounding box of a plate, while the red represents areas that plates have moved away from. Those lines? They represent an indicator that I have problems. So, either a bit more work, or forget about non-power-of-two dimensions for now.
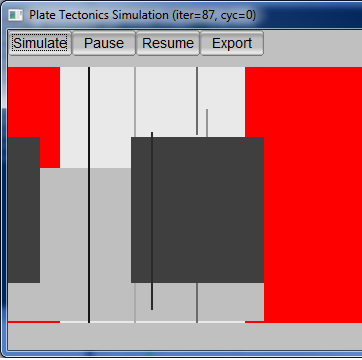 |
| Seeing red |
Friday, February 3, 2017
Plate Tectonics - 9
As I mentioned in my last post on this topic, I believe the erosion algorithm for the Plate Tectonics simulator needs to be tweaked. I've been analyzing the current erosion code and discovered that unlike the original version of PlaTec I worked with that basically used a smoothing algorithm, the version I'm working with now looks to be using the water drop erosion algorithm, akin to what is described as hydraulic erosion in Musgrave's work. In addition to the erosion proper, the function that implements the erosion also introduces some random noise (variations in elevation) every time the erosion function is called. The difference is "splotchy" without random variation vs. "grainy" with random variation, as seen in the image below. Have I discovered the need for yet another parameter?

The current set of parameters is already pretty large. I'm still working all of these parameters into the code base. A lot of them are currently constants. Now they need to go into/come out of the parameters window and get passed to the simulation code.
 |
| Parameter chaos. Perhaps grouping them into labelled groups and changing some into sliders will improve things? In many case, many times just leaving the values as-is works great. But not always. It depends on your goal. |
And I still need to back and fix the problem that I posted about previously, the "caterpillars" and over-eroded mountains. That's why I started looking at the erosion code in the first place. I basically want the land bordering on ocean to erode faster than the mountains. The "caterpillar" islands form from too little erosion of islands in the oceans formed by plate movement. Attempting to prevent the "caterpillars" by increasing the frequency with which erosion is applied causes the mountains to erode too quickly instead.
Conceptually, I think it is as simple as a scalar factor for the amount of material to move when the erosion algorithm moves material from a "high" cell to neighboring "low" cell(s). My first approach would be that the scalar could equal the sum the number of neighbor cells that are below sea level, divide by four (von Neumann neighborhoold, not Moore), plus 0.5. Hence a "high" cell that was inland would erode at half the nominal rate, a single-cell island would erode at 1.5 times the nominal rate, and cells belonging to larger islands or on the coast would erode at an intermediate rate. This actually makes some sense within the context of the simulation, as well, as wave action and rainfall would result in more erosion than rainfall alone. We'll see what it takes to implement that once I fully understand the existing implementation of the erosion algorithm, then how well it works in practice.
Thursday, February 2, 2017
Boredom
I am bored. Why am I bored? Because I'm performing final integration testing on some rather boring but important code, prior to releasing it for UAT (User Acceptance Testing). I am on my nth iteration of testing the code, various minor problems having cropped up that weren't apparent during development and unit testing. This is why integration test, afterall.
Alas, since the code being tested is for certain timeout functionality, I have to allow for at least a little bit of time to allow the multitude of components involved to start up and start working before the timeout is applied. This gives me a very few minutes of dead time during each test cycle. It is not enough time to do anything particularly useful, however. Hence this blog post. I caught up on work emails on the first couple cycles, checked the tech news after, and then caught up on the blogs that aren't NSFW. So now... this blog post.
Alas, since the code being tested is for certain timeout functionality, I have to allow for at least a little bit of time to allow the multitude of components involved to start up and start working before the timeout is applied. This gives me a very few minutes of dead time during each test cycle. It is not enough time to do anything particularly useful, however. Hence this blog post. I caught up on work emails on the first couple cycles, checked the tech news after, and then caught up on the blogs that aren't NSFW. So now... this blog post.
Wednesday, February 1, 2017
Plate Tectonics - 8
So close, yet so far. That's the best description of the current state of the Plate Tectonics code. I've got a decent feel for the parameters now, and will be exposing them through the UI so different effects can be achieved. However, there's two different artifacts caused by the erosion period parameter. Run erosion too frequently, and the mountains erode down from something like the Rockies, Alps, and Himalayas, to something more like the lesser portions of the Appalachians or Catskills. Run it too infrequently, and you get long "fuzzy" islands or island chains that remind me of caterpillars. Hours of running simulations show it is almost impossible to find a "happy medium" by simply adjusting the erosion period. I think the erosion algorithm needs to be tweaked to increase the level of erosion for sea-exposed cells and/or decrease it for land-bound cells. Perhaps a scaling factor calculated from the percentage of neighbor cells that are below sea level?
 |
| An example terrain mapped onto a globe |
 |
| Examples of "caterpillar" islands arising from too little erosion |
 |
| Examples of heavily eroded mountains, from too much erosion |
Monday, January 30, 2017
Reading, Writing, and Plate Tectonics
I made more progress yesterday with the Plate Tectonics simulator, almost finishing it. I tweaked the variables and all worked well at a 256x256, 512x256 and 512x512 resolution. Alas, I discovered that when the resolution is increased to 1024x512, certain parameters that are currently constants need to be changed, otherwise the results look clunky. So I need to go back and turn six constants into variables, expose them, and update the UI so they can be altered by the user. Probably another few days for release, because I'll want to run a lot of simulation cycles to be able to set decent defaults and provide recommendations for different setting levels.
My writing of The Forbidden Valley bogged down temporarily, but as I sit drinking hot cocoa, I think I know how to resolve the problem in the scene I'm working on. I'd written ahead of that point, but hadn't been able to resolve the problem in that scene. I think I have now, though, so snippets may be forthcoming again soon.
I read three novels yesterday: Loose Ends by John van Stry, and Scout's Law and The Fugitive Heir by Henry Vogel. All three were a lot of fun and I intend to write reviews when I have a chance - including brief ones on Amazon. I am also continuing with reading Lincoln Paine's The Sea & Civilization, a non-fiction maritime history, and have made it to just short of the one-third mark. This is a long but engrossing work, but is definitely a slower read than the romps provided by the novels I mentioned at the start of the this paragraph.
Sunday, January 29, 2017
Plate Tectonics - 7
Rectangular maps! At last, I have them. Alas, I must also do a lot of parameter tweaking. One of the peculiarities I'm running into is large numbers of enclosed basins. Initial land masses are formed using fractional Brownian motion (fBm) algorithm that uses OpenSimplex noise as its basis function. Aside from resulting in some enclosed basins (low points) in the land masses to start with, it also results in a number of islands and peninsulas that can result in basins when portions of land masses collide and there isn't enough subduction for the basin to be closed.
This is not totally unrealistic. There are a number of inland seas and massive lakes on Earth. The Caspian and Aral Seas are good examples of the former, and the Great Lakes of the latter. However, they do seem more prevalent in these maps. Perhaps reducing the number of "octaves" for the fBm will reduce that. I'm not sure yet. It will require some experimentation.
So, to summarize, more progress, but not quite done.
Saturday, January 28, 2017
Plate Tectonics - 6
The replacement of the square-diamond algorithm for initial land mass generation has been completed. The OpenSimplex algorithm is now in use instead. It may need some parameter tweaking to achieve quite the right effect, but is providing mostly-satisfactory effects already. Two examples are shown below. So what's left before release? Code-wise, the last alteration is supporting arbitrary map dimensions. The current code base assumes a square map, and there are well over a hundred references to variable map_side. I'm going to have to go through all of them and figure out if each reference needs to be replaced by map_width or map_height. Joy. Hopefully that will be the last of the changes, and then I can look at putting this up on GitHub and figuring out how to distribute the executable.
 |
| Example output from Plate Tectonics simulation |
 |
| Another example output from Plate Tectonics simulation |
Friday, January 27, 2017
Plate Tectonics - 5
I spent far too long this evening looking for noise on the web. I know, the signal-to-noise ratio of the web is often much higher on the noise than signal side of things, so it seems like looking at noise would be easy. But that's not what I mean. I'm talking about a noise algorithm, such as the Perlin noise algorithm invented by Ken Perlin, its successor simplex noise, or other viable noise functions that can serve as the basis function for fractals.
Why? Because I'm looking to replace the existing square-diamond fractal algorithm used by the Plate Tectonics simulator, in order to allow more flexibility in map dimensions. Alas, this turned out to be a bit more complicated than expected. The simulator's written in C++, so C++ or C code would be ideal. I already have such functionality in C#, but I'd have to port that to C++.
I could incorporate the Perlin noise reference implementation that's written in C (for which Professor Perlin received an Academy Award), but it is written in very old school C and could use some work to adapt to a more modern paradigm. LibNoise offers a nice implementation, but that's more dependencies than I'd like to add, and I think it might not be license-compatible. (I went back and checked. It is licensed under LGPL, so license is not a problem; still a bit leery of the dependency or adding so much additional code.)
Then there's simplex noise, also invented by Ken Perlin, but there's a patent on the using his particular flavor of the algorithm for generating a texture, which I'd worry applies to terrain as well, which is often treated as a texture. There's a great implementation C++ in battlestar-tux but it is GPL licensed and likely covered by that patent. There's a nice MIT-licensed implementation in C++ that but may be covered by the patent. There's the OpenSimplex approach, which deliberately implements simplex noise somewhat differently to avoid the patent issue, but I've only seen Java implementations, so porting would be required.
In short, everything has its pros and cons, and I need to sleep on it, make a call, put in the work, and get Plate Tectonics finished up and make it available online. My inclination at this time is to either take the partial OpenSimplex implementation and port it from Java to C++ or else update a copy of the reference implementation.
Tuesday, January 24, 2017
C++ integration with .NET Framework
I was making a bit more progress on the Plate Tectonics simulator when a thought occurred to me. The simulator is written in C++ and I'm compiling it as an executable with a relatively-recent edition of Microsoft Visual Studio. The simulator, and some of the other libraries it relies upon, are LGPL licensed. I can wrap the C++ code for compatibility with the .NET Framework, and produce a DLL, licensed under LGPL. Then I can use it from other software with more or less restrictive licenses (MIT, BSD, or something proprietary) without problems, because it is a library.
It seems like it should be fairly simple, technically speaking, but I've never done it before. I found a nice tutorial. The only sticking point is I haven't figured out how structs can be translated/marshaled between managed and unmanaged (native C++) code. For passing the ever-growing list of parameters for the simulation, I'll have to either do so or else make them available as properties of the main simulation class (not my preferred approach). I'll worry about it once I've got the Plate Tectonics simulator otherwise finished.
You may wonder why I'd want to do this. The main reason is because while the simulator is a good starting point for planet generation, it is a poor stopping point. Additional terrain generation, or even just pretty maps, should follow from it. This is one approach to that goal.
Fantasy word generator and generated novels
In yesterday's post, I mentioned stumbling across a small fantasy map generator. There's also a word generator associated with it, used to create place names. The approach in that word generator is based upon patterns (e.g. CVC for consonant-vowel-consonant) and partially-overlapping sets of letter/sound types (consonants, vowels, sibilants, ending). This is a different approach than taken in the word generator I mentioned in a couple of posts last fall - that used statistical patterns derived from a corpus of words used as input.
Apparently, both the fantasy map and word generators are ports from Python to JavaScript of code used in NaNoGenMo 2015, the National Novel Generation Month. That particular effort was known as The Deserts of the West and produced not so much a novel as an atlas and travel guide, along the lines of a gazetteer. The concept of NaNoGenMo appears to be analogous to NaNoWriMo, the National Novel Writing Month. NaNoWriMo promotes writing a novel in a month; NaNoGenMo promotes writing code within a month that can generate a novel.
When I discovered NaNoGenMo yesterday evening, I investigated a little, and the novels produced by NaNoGenMo aren't particularly interesting to me in a literary sense. (A few were better than some of what I was subjected to in college English classes, though.) I do not think actual authors have anything to fear from the output of these programs. However, they were of some technical interest. They did produce proper paragraphs and sentences. Many of them were even fairly coherent. I just didn't find any particularly interesting as reading material.
On the other hand, I find the gazetteer approach of The Deserts of the West fascinating. That is, both the concept and the output intrigue me. I may investigate them more thoroughly at some point. In a way, they seem to be nothing more than an expansion on some of the tools and tables used in role-playing games, be they pen and paper or computer.
OK, that's it for my lunchtime post. Time to finish eating and get back to work.
Tuesday, January 17, 2017
A simple digital globe - 4
The simple digital globe from my September posts has had a small update to correct a texture (UV) mapping problem at the north pole. This problem was actually longstanding, but when I was viewing the output from the Plate Tectonics simulator yesterday using it I finally decided to spend the time tracking the problem down and fixing it.
It turns out the distortion results from the vertex sharing required for auto-generating normals that make the polyhedron look like a globe. The fix turned out to be to deliberately introduce minute differences into the y coordinate of the vertex at the north pole, so each triangle at the top had a minutely different vertex position at the top but with much different texture coordinates. The details can be seen in comments in the source code.
The source code is available under MIT license at https://github.com/AnAvidDeveloper/Globe. I will look into making a binary available in the future.
 |
| Globe program displaying output from Plate Tectonics simulator |
It turns out the distortion results from the vertex sharing required for auto-generating normals that make the polyhedron look like a globe. The fix turned out to be to deliberately introduce minute differences into the y coordinate of the vertex at the north pole, so each triangle at the top had a minutely different vertex position at the top but with much different texture coordinates. The details can be seen in comments in the source code.
The source code is available under MIT license at https://github.com/AnAvidDeveloper/Globe. I will look into making a binary available in the future.
 |
| Globe program displaying output from Plate Tectonics simulator, looking at the North Pole. Note the minor distortion at the center (pole), expected of a flat map wrapped around a sphere. That pinching is much improved over the strange swirl that was there before. If there are ice caps, nobody will even notice. |
Sunday, January 15, 2017
Plate Tectonics - 4
I didn't accomplish as much as I'd hoped today, courtesy of Real Life. In any case, I made a bit more progress on the Plate Tectonics simulator. Alas, I also decided to finish up a few things I'd originally though to leave for the future, so I'm not sure I'm actually any closer to completion. [sigh]
In a post yesterday, I mentioned I'd found code for a more recent version of the PlaTec simulator. I've incorporated most of that updated code and done some minor refactoring to better modularize the program. Previously, the simulation and the UI had been a bit too intertwined, legacy of my not having done anything much in C++ for ages, and only second time using the GUI framework in question (FLKT).
So what did that get me? The updated PlaTec code brought better erosion algorithm, fewer visual anomalies, and slightly slower simulation. The refactoring will eventually allow console-based execution as well as the current interactive GUI mode. And I've made a few more parameters accessible via the GUI. However, two parameters that are the GUI no longer accomplish anything. I have to modify the updated PlaTec code to permit the parameters in question to be supplied via code, rather than treating them as hard-coded constants. One of the other features I'd originally considered for a future enhancement, a parameters file, I have decided to at least completed the code for writing to file. Reading in is likely still a future enhancement, but I'd like to know what parameters I used to create any given map.
In a post yesterday, I mentioned I'd found code for a more recent version of the PlaTec simulator. I've incorporated most of that updated code and done some minor refactoring to better modularize the program. Previously, the simulation and the UI had been a bit too intertwined, legacy of my not having done anything much in C++ for ages, and only second time using the GUI framework in question (FLKT).
 |
| Updated parameters dialog box |
So what did that get me? The updated PlaTec code brought better erosion algorithm, fewer visual anomalies, and slightly slower simulation. The refactoring will eventually allow console-based execution as well as the current interactive GUI mode. And I've made a few more parameters accessible via the GUI. However, two parameters that are the GUI no longer accomplish anything. I have to modify the updated PlaTec code to permit the parameters in question to be supplied via code, rather than treating them as hard-coded constants. One of the other features I'd originally considered for a future enhancement, a parameters file, I have decided to at least completed the code for writing to file. Reading in is likely still a future enhancement, but I'd like to know what parameters I used to create any given map.
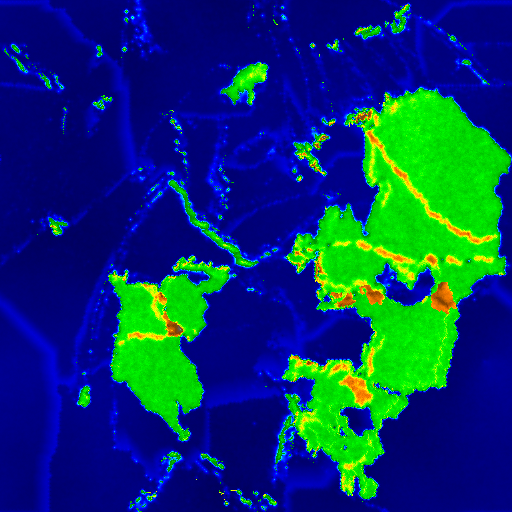
 |
| Map generated using updated (2015) PlaTec code. Note the greater variation in elevation, as depicted by color variation, as compared to earlier examples. Note also that there are fewer high plateaus. The number of strange islands is also reduced, replaced by more coherent islands. |
 |
| Map created with earlier PlaTec code. Note lesser variation in elevation/color, and greater number of high plateaus. |
Subscribe to:
Posts (Atom)