Today I purchased and read A Carpathian Campaign, a novel by Alma T. C. Boykin. The novel is an alternate history with some science fictional / fantastic elements. The world of A Carpathian Campaign is recognizably similar to ours on the surface, but there are some clear differences that extend back in time, and others that take place as we watch: battles gone differently, borders subtly shifted, personnel changed.
It is set in the early 20th century, and covers the early years of an alternate Great War (World War One). The protagonist and main view point character is István Eszterházy, a young Hungarian aristocrat serving in the army of the Austro-Hungarian Empire. As events are largely seen through his eyes, the focus is most often on immediate and familial concerns, though the big picture and grand strategy do play a part in his thoughts. He is also a largely understandable character, his concerns and perspective easy to related to - even for those of use who aren't HalfDragon Hungarian aristocrats of a century ago.
I've only read a few books on the WWI Eastern front and its aftermath. This novel fits well with the ambiance depicted in such books. The battle fronts tended to be far more fluid than on the Western front, with massive advances and retreats common. Victories and defeats of massive scope and scale could and did occur. Sieges tended to be limited to fortresses and strategic terrain, not continent-length lines. All of that is shown fairly well in A Carpathian Campaign.
The novel is set in the same universe as Boykin's A Cat Among Dragons series, but requires no knowledge of those stories. This novel stands well on its own. (Actually, it stands even better with a separate map so its clear when the story is in the titular Carpathian mountains, but that's a minor nit - and there's a map in the book, but its inconvenient to reference while reading.)
I'd definitely recommend this book. I enjoyed it thoroughly. It does leave a lot of open questions. When it ends István Eszterházy and the Austro-Hungarian Empire alike are facing a uncertain future. Dragons, Houses, Gifts, and the Powers are not fully explained. That's fine for the first volume in a series, of course, and hopefully more volumes will follow that continue the story and help explore some of these topics further.
It made a nice treat on my first day back, recovering from the return trip after visiting family over the Christmas holiday. I hope everybody reading this had a splendid Christmas, Chanukah, or even Festivus. I managed to read a few books over the holiday time so expect a few more book reviews in the near future.

This blog covers my adventures in reading, writing, procedural content generation, and whatever else comes to mind.
Thursday, December 29, 2016
Saturday, December 24, 2016
Merry Christmas!
Merry Christmas, everybody! My online time is currently sporadic due to the holidays, but I shall resume normal blogging in a few days. Until then, I leave you with the image of the snowman, er, tree, er, treeman?


Thursday, December 22, 2016
Essential Geometry 2: Basic operations
Yesterday's post covered geometric primitives and basic shapes for use in a 3D procedural modeling framework. Today's post covers some basic operations that can be performed using those primitives and shapes.
We'll start off with the basic transformation operations. A geometric primitive can be translated (moved), rotated (orientation adjusted), or scaled (made larger or smaller). These are fairly basic operations which are well understood, and are typically performed using linear algebra (matrix math). Since this is such a well-documented area, I won't address it in great depth, other than to say these are truly fundamental operations for 2D and 3D geometry on a computer. Even if you're not planning on procedural modeling, any framework needs to support them.
Next we'll discuss three operations for generating 3D content from 2D polygons. Extrusion, revolution, and sweeping can all be powerful operations. I mentioned extrusion briefly a few posts back. It can be used to generate tubes, columns, boxes, ducts, buildings, etc. from a simply polygon like a rectangle, octagon, etc. Implementing extrusion is fairly simply. Make a copy of the polygon. Translate the copy along the extrusion vector (red arrow in figure 2). Then for each edge of the original polygon, create a new rectangular face that connects that edge with the corresponding edge on the copy.
Revolution is similar but a bit more complex. With revolution, a polygon is swept through space in a circular arc around an axis. (In figure 3, the axis is shown as the red vertical line.) The arc may be partial (e.g. 90 degrees) or may be a complete circle. To implement, we perform the rotation as an iterative process. Make a copy of the polygon and rotate it some fraction of the desired rotation. As with extrusion, create faces between edges of the previous polygon and the next polygon. Repeat the process until the desired rotation is accomplished.
Sweep is similar to revolution, but rather than simple rotation about an axis it involves following a path. The path could be defined by a line segment (like extrusion), an arc (like revolution), a polyline, or a spline. I cannot fully describe implementation at this time as it is something I am actively working on a proper implementation for, as I intend to use sweep for road and railroad shapes.
Constructive solid geometry (CSG) operations are used to manipulate 3D solids (polyhedrons) much like boolean or set operations. A union combines two solids. An intersection yields the portion of solids that overlap. A difference removes that part of solid A which solid B overlaps. The simplified 2D equivalent of these operations is shown in figure 5.
You may be wondering why CSG is useful. If you wanted to create a dimpled cube, you could take the difference between a cube and a sphere. If you wanted a thick-walled hollow tube, you could take the difference between one cylinder and a cylinder of smaller diameter. You could use CSG to put window and door shaped holes into walls, carve star-shaped patterns into a box representing a frieze, or carve or raise decorative elements for columns.
CSG operations can be implemented using BSP (binary space partitioning) trees. In Game Programming Gems 5, Octavian Marius Chincisan has an article on doing so, "CSG Construction Using BSP Trees," with an accompanying C++ implementation. The OpenJSCAD uses a JavaScript implementation (CSG.js) to perform CSG operations inside a web browser, rendering them via OpenGL. I ported CSG.js to C# but have yet to fully integrate it into anything just yet. The tests for it produce output files which I can view using Blender.
There are more useful operations to discuss - such as those used in CGA Shape, and some common operations for edges - but those will wait for a future day. This post covers some of the basic essential operations and provides some details to aid in implementation.
We'll start off with the basic transformation operations. A geometric primitive can be translated (moved), rotated (orientation adjusted), or scaled (made larger or smaller). These are fairly basic operations which are well understood, and are typically performed using linear algebra (matrix math). Since this is such a well-documented area, I won't address it in great depth, other than to say these are truly fundamental operations for 2D and 3D geometry on a computer. Even if you're not planning on procedural modeling, any framework needs to support them.
| Figure 1: Transformation operations |
Next we'll discuss three operations for generating 3D content from 2D polygons. Extrusion, revolution, and sweeping can all be powerful operations. I mentioned extrusion briefly a few posts back. It can be used to generate tubes, columns, boxes, ducts, buildings, etc. from a simply polygon like a rectangle, octagon, etc. Implementing extrusion is fairly simply. Make a copy of the polygon. Translate the copy along the extrusion vector (red arrow in figure 2). Then for each edge of the original polygon, create a new rectangular face that connects that edge with the corresponding edge on the copy.
 |
| Figure 2: Extrusion |
Revolution is similar but a bit more complex. With revolution, a polygon is swept through space in a circular arc around an axis. (In figure 3, the axis is shown as the red vertical line.) The arc may be partial (e.g. 90 degrees) or may be a complete circle. To implement, we perform the rotation as an iterative process. Make a copy of the polygon and rotate it some fraction of the desired rotation. As with extrusion, create faces between edges of the previous polygon and the next polygon. Repeat the process until the desired rotation is accomplished.
 |
| Figure 3: Revolution |
Sweep is similar to revolution, but rather than simple rotation about an axis it involves following a path. The path could be defined by a line segment (like extrusion), an arc (like revolution), a polyline, or a spline. I cannot fully describe implementation at this time as it is something I am actively working on a proper implementation for, as I intend to use sweep for road and railroad shapes.
 |
| Figure 4: Sweep |
Constructive solid geometry (CSG) operations are used to manipulate 3D solids (polyhedrons) much like boolean or set operations. A union combines two solids. An intersection yields the portion of solids that overlap. A difference removes that part of solid A which solid B overlaps. The simplified 2D equivalent of these operations is shown in figure 5.
 |
| Figure 5: Constructive solid geometry (CSG) operations |
You may be wondering why CSG is useful. If you wanted to create a dimpled cube, you could take the difference between a cube and a sphere. If you wanted a thick-walled hollow tube, you could take the difference between one cylinder and a cylinder of smaller diameter. You could use CSG to put window and door shaped holes into walls, carve star-shaped patterns into a box representing a frieze, or carve or raise decorative elements for columns.
 |
| Figure 6: Some scenarios for CSG use |
 |
| Figure 7: Rendering of a shape produced using CSG operations. |
There are more useful operations to discuss - such as those used in CGA Shape, and some common operations for edges - but those will wait for a future day. This post covers some of the basic essential operations and provides some details to aid in implementation.
Wednesday, December 21, 2016
Essential Geometry 1: Primitives and Basic Shapes
I've been thinking about the architecture for dealing with procedural generation for material culture: buildings, bridges, roads, fountains, etc. I mentioned a bit in previous posts about procedural generation of buildings, terrain, and even language. The building blocks of these different types of procedural content vary greatly, but for material culture it is represented in a virtual world by geometry. Culture and semantics may drive arrangement and meaning, but the representation ultimately takes the form of geometry.
Mostly it is simple angular or curved geometry, not organic shapes. As such, such geometry is often easily described in terms of primitives. The most basic primitives are simple, generic representations of shapes in zero to three dimensions. In the example below, a four-sided rectangle is shown for the face (polygon), but that could as easily be a hexagon, an octagon, etc. Likewise, the polyhedron could be a dodecahedron, a tetrahedron, or an arbitrary mesh.
Because rendering 3D graphics usually requires a similar representation to what I've just described (triangles are best), more complex representations are built upon these basic geometric primitives. When rendering, even a cylinder, sphere, cone, or torus is an approximation in the form of a polyhedron. (Ray tracing is sometimes an exception.) All of the shapes in the figure 2 below could be represented as either a face/polygon or as a polyhedron.
For procedural modeling, being able to easily create the basic shapes above can be quite useful. However, we still only need to have classes that represent the four primitives in figure 1. Any shape from figure 2 can be generated as an instance of one of the classes from figure 1. A shape factory can generate the required instances based upon supplied parameters. As such, a class representing each basic shape is not required in all situations; I do not plan to create such classes, and plan to rely upon a shape factory utility class to generate instances of the figure 1 classes that represent figure 2 shapes.
Mostly it is simple angular or curved geometry, not organic shapes. As such, such geometry is often easily described in terms of primitives. The most basic primitives are simple, generic representations of shapes in zero to three dimensions. In the example below, a four-sided rectangle is shown for the face (polygon), but that could as easily be a hexagon, an octagon, etc. Likewise, the polyhedron could be a dodecahedron, a tetrahedron, or an arbitrary mesh.
 |
| Figure 1: Essential geometric primitives |
Because rendering 3D graphics usually requires a similar representation to what I've just described (triangles are best), more complex representations are built upon these basic geometric primitives. When rendering, even a cylinder, sphere, cone, or torus is an approximation in the form of a polyhedron. (Ray tracing is sometimes an exception.) All of the shapes in the figure 2 below could be represented as either a face/polygon or as a polyhedron.
 |
| Figure 2: Useful basic shapes |
There are well-known algorithms for most of them. The GLUT library used with OpenGL contains implementations of algorithms for generating the sphere, cube, cone, torus, dodecahedron, octahedron, tetrahedron, icosahedron, and the ever-populate teapot shapes. The FreeGLUT library is an open-source (MIT X licensed) alternative to GLUT so you could review that source code for examples, or search online. Paul Bourke's web site has descriptions and details for some of them, such as the superellipsoid.
Some of the 3D shapes can also be produced by performing an extrusion or revolution of a sphere or rectangle. I'll address that more in a future post on geometric operations that should be supported in order to provide for procedural modeling capabilities. This post has covered the primitives and the basic shapes at a high level. More details will be discussed in future posts.
Tuesday, December 20, 2016
Happy Trails
At a number of blogs I follow, there have recently been a number of posts regarding trails, roads, and towns. I've been posting a bit about them two, with regards to procedural sketching and procedural content generation. I'm also trying to recover from too much food from the office "holiday luncheon" and am suffused with good feelings. So I say to all of you out there, Happy Trails!
 |
| Along the Oregon Trail outside Scotts Bluff, Nebraska |
Generating Novel Towns
I'm nearing completion on a database and application to gather data regarding American towns from a century ago. The data collected should give me the details I need to reliably recreate novel yet plausible American-style towns. However, actually creating the towns requires something else. It requires the rest of the features I've shown in embryonic form in the spline prototype: roads, railroads, and buildings.
So what data do I plan to collect to provide the statistical basis for plausible towns? There's general data regarding the town that determines some high-level aspects of the town layout: population, the size and shape of the central business district, whether there is a central square, and whether the town is a county seat (which requires a county courthouse). There's data on the railroad(s) in town that need to be collected, including the spatial relationship of the railroad to the central business district. Data on individual government, religious, commercial, industrial, and utility buildings will be collected, including details of rail service.
Very little data on individual homes will be recorded. An initial glance at Google Earth imagery and Sanborn Fire Insurance maps suggests to me that house style and construction materials have far more to do with date of construction and region than with population or other factors. Prevalence of Brick vs. stone vs. frame construction varies mostly by region and age of the town, and age of the structure. Style is dependent upon region and date of construction. There's also far more data on residential units than the rest of a town, and it is largely less relevant to capturing the feel of a town, in my opinion.
Also collected will be details on businesses and other institutions. Businesses will include industrial and commercial establishments. The business data will be tied to the building data. What's this business data good for? It lets me know for a given population, how many businesses, and what types, should be added to the town, and where. While I expect the commercial establishments to vary a little between regions, I expect the industrial establishments to vary to a greater extent. One would expect more canneries in fruit growing regions and more creameries in dairy regions. A large town on the American plains should have more grain elevators. I think a coal yard, lumber yard, and oil dealer could show up anywhere.
So where am I collecting the data from? Mostly from the Sanborn Fire Insurance maps. Utah, Indiana, and Pennsylvania all make their pre-1923 maps available online to the general public, I can access the Ohio maps by virtue of being a resident of Ohio, and the Library of Congress has partial online coverage of various states. USGS Topographical Maps, Google Earth, and historical railroad maps may also play a part.
A lot of the other data that is collected will be helpful in procedural generation of novel towns. Street names, for example, can be pulled from the collected data in a probability-derived manner. Building footprint size may also be useful when subdividing blocks and generating buildings. Certainly knowing the number of floors for buildings is useful, as well - especially combined with the population data. Knowing that, hypothetically, a town with a population of 1000 should have 10 shops along either side of Main Street, with heights of one or two floors, plus three industries along Railroad Street, is useful to make a town believable.
Even after the town data is collected and useful statistics are available, a lot more graphics code will need to be written to actually generate and visualize a new town. The split-based code I mentioned in yesterday's post is part of the likely building generation solution. The road and railroad code needs additional work, particularly with respect to intersections and switches, respectively. And I need to finish up the straight skeleton calculation code, which along with buffer operations (inset/outset) is needed for both building generation and generation of lots for a block. Speaking of blocks, I need to finish up implementation of minimum cycle basis code based upon David Eberly's paper, which is required to "recognize" the blocks in a generated plan of roads in the town.
All in all, there's still a lot to do, but a little bit more gets done each day. Until the holidays come. Then work will likely grind to a halt for a few days. Maybe I can find something else to blog about then.
 |
| A portion of a Sanborn Fire Insurance Map |
Very little data on individual homes will be recorded. An initial glance at Google Earth imagery and Sanborn Fire Insurance maps suggests to me that house style and construction materials have far more to do with date of construction and region than with population or other factors. Prevalence of Brick vs. stone vs. frame construction varies mostly by region and age of the town, and age of the structure. Style is dependent upon region and date of construction. There's also far more data on residential units than the rest of a town, and it is largely less relevant to capturing the feel of a town, in my opinion.
Also collected will be details on businesses and other institutions. Businesses will include industrial and commercial establishments. The business data will be tied to the building data. What's this business data good for? It lets me know for a given population, how many businesses, and what types, should be added to the town, and where. While I expect the commercial establishments to vary a little between regions, I expect the industrial establishments to vary to a greater extent. One would expect more canneries in fruit growing regions and more creameries in dairy regions. A large town on the American plains should have more grain elevators. I think a coal yard, lumber yard, and oil dealer could show up anywhere.
So where am I collecting the data from? Mostly from the Sanborn Fire Insurance maps. Utah, Indiana, and Pennsylvania all make their pre-1923 maps available online to the general public, I can access the Ohio maps by virtue of being a resident of Ohio, and the Library of Congress has partial online coverage of various states. USGS Topographical Maps, Google Earth, and historical railroad maps may also play a part.
 |
| Screenshot of the prototype |
Even after the town data is collected and useful statistics are available, a lot more graphics code will need to be written to actually generate and visualize a new town. The split-based code I mentioned in yesterday's post is part of the likely building generation solution. The road and railroad code needs additional work, particularly with respect to intersections and switches, respectively. And I need to finish up the straight skeleton calculation code, which along with buffer operations (inset/outset) is needed for both building generation and generation of lots for a block. Speaking of blocks, I need to finish up implementation of minimum cycle basis code based upon David Eberly's paper, which is required to "recognize" the blocks in a generated plan of roads in the town.
All in all, there's still a lot to do, but a little bit more gets done each day. Until the holidays come. Then work will likely grind to a halt for a few days. Maybe I can find something else to blog about then.
Sunday, December 18, 2016
Dealing with the Great Big World 3
I've discussed some of the terrain-related portions of dealing with the Great Big World before. I'm going to touch on another aspect in this post - buildings.
I'm working on the (software) architecture for a fresh prototype for the splines and sketching that I've posted about in the past. I'd originally planned to continue work with that prototype, but the architecture is just poorly suited as it stands now. I'll be reusing a lot of the code, but trying to shoehorn the changes into the original prototype wasn't working well. Nothing from that is even close to ready to show, though. So let's discuss buildings.
I'm working on the (software) architecture for a fresh prototype for the splines and sketching that I've posted about in the past. I'd originally planned to continue work with that prototype, but the architecture is just poorly suited as it stands now. I'll be reusing a lot of the code, but trying to shoehorn the changes into the original prototype wasn't working well. Nothing from that is even close to ready to show, though. So let's discuss buildings.
 |
| The old prototype, showing a river, road, railroad, and three buildings. |
There are three buildings in the screenshot above, represented by the dark blue-gray polygons at upper left, near where the railroad crosses the road (to get to the other side). For a decent 3D representation, what would we do? We could substituted manually-modeled building models, be they free, purchased, or created personally. But imagine trying to store a 3D model for every planet on a building, let alone model them all. Its not very practical, although it is perfectly feasible to do for some signature structures, such as a few buildings in a national capital, or the tallest, signature skyscrapers in a city. What does that leave us as an alternative? Procedural modeling of buildings.
That's start with a very simple form of procedural modeling. Our starting point will be the polygons in the map that represent buildings. Each such polygon is the footprint of a building. If each such a polygon were extruded upwards, we would get a polyhedron from each polygon.
That's start with a very simple form of procedural modeling. Our starting point will be the polygons in the map that represent buildings. Each such polygon is the footprint of a building. If each such a polygon were extruded upwards, we would get a polyhedron from each polygon.
 |
| Extrusion process - from polygon to polyhedron |
But that only gives us a simple three dimensional form. We could apply a texture to it. If there's a nice tiling (repeatable) texture for brick or stone, it could allow one to accept the polyhedron as a building - especially if some windows and doors were part of the pattern. This may even work well enough in some scenarios, in fact. If each polyhedron had a random texture from a set of of such textures assigned, the buildings wouldn't all look alike, either. A couple examples of such textures, generated via Filter Forge 5 filters, are shown below. It might be good enough for a flight simulator or a train simulator, or for more-distant background buildings in any game or simulation.
 |
| Brick texture created using filter Bricks version 1 |
 |
| Window in wall texture created using filter Window gen |
For buildings that are more close up, as in a driving game, a first person shooter, or just a VR scenario that involves walking down the street, it'll fall flat pretty fast. Thankfully, there are solutions. There are plug-ins and packages for many game engines and modeling tools that will help with some of this. Unity features the BuildR asset in its Asset Store, for example. And then there's perhaps the ultimate expression of procedural building generation, ESRI's CityEngine.
ESRI is primarily a GIS (geographic information systems) company, producers of the ArcGIS product. However, they purchased a company out of Zurich named Procedural, Inc. that had produced a product called CityEngine. CityEngine can create entire cities, including detailed building models. For building generation, it uses something called CGA Shape Grammar. CGA Shape Grammar is discussed at length in a 2006 paper by Pascal Mueller, Peter Wonka, Simon Haegler, Andreas Ulmer, Luc Van Gool, Procedural Modeling of Buildings. You can look at that paper and the online documentation for CityEngine if you want to learn all the details, but I'll cover a few high points below, greatly simplified.
Basically, CGA Shape Grammar is a production system like L-systems in which a set of rules are defined. When fed some initial data (such as the polygon of the building footprint) the rules are iteratively applied and a building is generated. The rules can use operators such as extrude and split to manipulate the 3D dimensional polyhedron or the polygon faces. Extrude works in much the manner as described above.
Split lets a polyhedron or polygonal face be split into multiple parts, so different rules can be applied to different parts. For example, in the image below a polyhedron has been split in two and two different textures have been applied to the top half and the bottom half. This is a common scenario. Note the difference in fenestration between the first and second stories in the photo.
Implementing split of a polyhedron or polygon is fairly simple. Since the polyhedron is little more than a collection of polygons, splitting a polyhedron is simply a matter of splitting the polygons. A plane defines where splitting takes place. See Graphic Gems V "Spatial Partitioning of the Polygon by a Plane" for details on implementing such an algorithm.
The split operation in CGA Shape can take a set of mixed absolute and relative dimensions for the split operation. This involves calculating a set of planes to split by. The splits are then performed sequentially. The outputs of the split can then be addressed by further rules.
ESRI is primarily a GIS (geographic information systems) company, producers of the ArcGIS product. However, they purchased a company out of Zurich named Procedural, Inc. that had produced a product called CityEngine. CityEngine can create entire cities, including detailed building models. For building generation, it uses something called CGA Shape Grammar. CGA Shape Grammar is discussed at length in a 2006 paper by Pascal Mueller, Peter Wonka, Simon Haegler, Andreas Ulmer, Luc Van Gool, Procedural Modeling of Buildings. You can look at that paper and the online documentation for CityEngine if you want to learn all the details, but I'll cover a few high points below, greatly simplified.
 |
| Geometric primitives |
Basically, CGA Shape Grammar is a production system like L-systems in which a set of rules are defined. When fed some initial data (such as the polygon of the building footprint) the rules are iteratively applied and a building is generated. The rules can use operators such as extrude and split to manipulate the 3D dimensional polyhedron or the polygon faces. Extrude works in much the manner as described above.
Split lets a polyhedron or polygonal face be split into multiple parts, so different rules can be applied to different parts. For example, in the image below a polyhedron has been split in two and two different textures have been applied to the top half and the bottom half. This is a common scenario. Note the difference in fenestration between the first and second stories in the photo.
 |
| Polyhedron split process |
 |
| Note difference in windows between first and second floors. |
 |
| Polygon split process |
The split operation in CGA Shape can take a set of mixed absolute and relative dimensions for the split operation. This involves calculating a set of planes to split by. The splits are then performed sequentially. The outputs of the split can then be addressed by further rules.
I am not planning to implement the full CGA Shape Grammar system as described in the paper. Even the rule-based approach is probably more than I care to bother with. However, a few of the operations defined therein could be useful. If the CGA Shape Grammar style of extrude, split, and repeat operations are implemented as C# methods that are part of a broader set of geometric primitives and procedural modeling capabilities, C# code or PowerShell scripts could access them. Combined with Constructive Solid Geometry (CSG) techniques they could provide a very compact representation of buildings without requiring prohibitively-extensive modeling. Can a few scripts generate the buildings for an entire world? Perhaps.
(PS - The roof generating operations would be nice to have for residential architecture. More thoughts on that later.)
The Pizza Corridor and the BBQ Corridor
In the Cincinnati area, it seems like the restaurants serving different types of cuisines are not distributed very evenly. There is clustering of sorts going on. For example, take BBQ and New York style pizza.
BBQ seems to be concentrated in a corridor along Hamilton Avenue, stretching from Mount Healthy in the south to Fairfield in the north. There's Goodies (which I've yet to visit) and Pit-to-Plate in Mount Healthy, Big Art's about a mile west, and the Butt Shack at the north end.
New York style pizzerias seem to be concentrated along the Montgomery Road corridor, with a jog northwest to Mason. There's Aponte's in Mason (technically a New Jersey style place), then the Flying Pizza at Fields Ertel and Montgomery in Symmes Township, and Brooklyn Pizza and Pasta in on Montgomery Road in Montgomery. Add to that the pizzerias that serve a somewhat similar style in that area, and it gets even more concentrated. There's Pomodori's in Montgomery, a block east of Montgomery Road, and two locations of Cincinnati-based chain Dewey's Pizza, in Symmes Township and in Kenwood. Then there's the four chains of fast casual pizzerias that seem to offer pizza in a semi-NY style, all of which presently seem concentrated along Montgomery Road or Mason-Montgomery Road: one Blaze Pizza, two Pizzeria Locales, two Rapid Fired Pizzas, and a Cucinova. There's even an interesting place called Pizza Tower. Most of the pizzeria's that aren't big national chain pizzerias or a Cincinnati-style* pizzeria like LaRosa's seems concentrated in that corridor
This is not to say that there aren't other BBQ places or New York style pizzerias - but there does seem to be some sort of odd clustering going on. There's a much smaller secondary cluster of pizzerias near the campus of the University of Cincinnati, and the Five Burroughs pizzeria is far from both. The most famous BBQ joint in the Cincinnati area is the Montgomery Inn, in Montgomery, not the small mom-and-pop places on or near Hamilton Avenue. But there definitely seems to be clustering. No clue why. Population density doesn't seem to be it. Maybe cultural factors? Just a random musing.
* Cincinnati-style pizza seems to be in the style of LaRosa's, a 60+ year old local chain. The crust tends to be thicker and firmer than New York style, and it is topped with provolone rather than mozzarella.
Friday, December 16, 2016
Dealing with the Great Big World 2
My post yesterday entitled "Dealing with the Great Big World" failed to fully make clear what part of the "Great Big World" problem was being addressed. It is the storage aspect which is being addressed there. Storing a complete high resolution elevation data set for a planet as raster data, or contours, or meshes, is possible but impractical without consuming extremely large quantities of disk space. The combination of coarse raster data and details via vector-based definitions that can drive a procedural representation offer a better option with respect to stoarage size.
This is part of the reason for the "spline" series of posts I'm making. Splines for defining mountain ridgelines have a great potential for a compact representation of mountain ranges. Alternately, the splines can define the center line of a wider ranger. Note that I'm using "splines" here as a shorthand for any open linear skeletal primitive, including not only the rounded nonuniform splines used in my "spline" examples but also line segments, polylines, etc. They're all transformed "behind the scenes" to a sequence of one or more line segments.
Using a related technique, a polygon can be used to define the boundaries of a larger and less linear area of mountains. This also applies to other closed primitives such as squares, circles, etc. All of these can be converted into a closed sequence of line segments.
The other two areas of concern in dealing with the "Great Big World" are coordinate precision and the rounded shape of the world. How those are resolved in conjunction with the solution I mentioned above is unclear. Persisting the coordinates that define splines (and other skeletal primitives) using double precision numbers may be part of the solution, as could using the "segmented distance" approach for perssistence. Storing coordinates as double precision latitude and longitude might work. In all cases, conversion to an appropriate coordinate system for rendering will be required. It is entirely possible that conversion for preprocessing will also be required. I have more thinking to do in that regards.
Thursday, December 15, 2016
Movie Review: Rogue One
This evening I went to see Rouge One, the latest installment in the Star Wars saga. Aside from the opening scene, set just a few years after the events of Revenge of the Sith, the movie takes place shortly before the events of A New Hope. "Shortly before" as in it starts no more than a few weeks before and ends almost immediately before the first scene of A New Hope.
As anybody whose seen even a little bit of the trailers and commercials knows, it is the story of how a team of misfits from the Rebel Alliance sought to acquire the plans to the Death Star, which played such a pivotal role in the original Star Wars movie (Episode IV: A New Hope). Since the plans were clearly in Rebel possession at the start of A New Hope, it might lead you to wonder if there's any room for meaningful tension.
In fact, there is. Leaving aside the possibility that our band of misfits fail and the plans were acquired in other ways, there is of course the question of what fate befalls the characters. Over the course of a movie that runs for about two hours and fifteen movies, a band of misfits forms and goes off on the mission. First there is Jyn Erso, the semi-orphaned young woman whose father was forced into Imperial service as a weapons designer. Then there is the Rebel spy, Captain Cassian Andor, and his droid sidekick, K-2SO. Then we come to the warriors Chirrut Imwe and Baze Malbus, who join them from the moon Jedha, and the defected Imperial pilot Bodhi Rook.
This band of misfits witness the Death Star devastate a world even when firing at only partial power. The power of the Death Star cause any who believe the tales of existence to fear. It is for this reason that our pluck band of misfits seek the Death Star plans, which they believe can lead them to stop it. The quest to acquire the plans proves to be epic.
Enough about that. That's likely as far as I can go without too many spoilers. Go watch the movie or read the novelization if you want the nitty gritty details of the plot. The plot moves fairly fast, but it slows down in a few spots where it needs to. I am quite happy with the pace and plot, more so than with The Force Awakens. While it does retread ground tangentially addressed by the opening crawl of A New Hope, it is nonetheless not a rehash.
There are a few tropes and cliches, but none should mistake it for the near pastiche or homage that was The Force Awakens. It is good in its own right, but ties in quite tightly with A New Hope. Despite that tight connection, a viewer of Rogue One needs no real knowledge of any Star Wars movies. There's a few spots where those unfamiliar with Star Wars might be left with a few questions, but nothing very problematic.
It does feature quite a few cameos by characters (and a few actors) we've seen in Star Wars before. I will not list them, for they might spoil things, but I will say that villains and heroes Star Wars fans know well do make their appearances. A few favorite locations from the past also make appearances, and the movie does a good job of making you feel like you're in the same universe as A New Hope. What do not make an appearance are Jedi (unless in they're in the audience).
There are battles in air, on the ground, in space. There's sneaky spy stuff. There's a few slower bits, about politics and choices, and about doing the best one can in difficult circumstances. There is joy, there is sadness, there is fear, and there is here and there an occasion for laughter. There is also a strong sense of the true evil of the Empire, displayed quite well, and repeatedly, for any who might doubt it. The only "shades of gray," so to speak, are in the actions of some of the Rebel spies, and that is addressed directly. To crudely paraphrase one of them: "We did a lot of things we weren't proud of. Let's make it count for something."
All in all, I quite enjoyed the movie. It felt like a Star Wars movie, it sounded like a Star Wars movie, and it looked like a Star Wars movie. The plot made sense, the pace made sense, and it fit into the universe seamlessly while still having enough of its one scope not to feel too predestined.
The acting was good. I thought all of the characters were portrayed as they were meant to be. Characters who were portrayed by actors other than the originals still seemed to fit well,
The effects were plentiful but restrained - they were seldom gratuitous. It looked like they made extensive use of practical sets, based upon the visuals and the multiple filming locations indicated in the credits. Everything felt more real than what resulted from the green screen and CGI sets of the prequel trilogy.
As you might guess from this review, I did in fact enjoy the movie a lot. I would definitely recommend going to see it. Much fun was had watching the movie. Then more was had watching the Jedi couple use the light from their lightsabers to help search for something they'd dropped on the floor during the film. :)
Dealing with the Great Big World
As I mentioned in previous posts, the world is very large. Storing detailed data about the topography, hydrology, biological, and sociocultural aspects of an entire Earth-sized planet would be impractical without massive amounts of disk space. Elevation data alone is voluminous. Procedural techniques such as fractals and other functional approaches can help, but are not a full solution in and of themselves.
A potential compromise is generation of a coarse raster or vector map of the planet, with details provided procedurally and/or stored as vector data. Simulations can
work with the data as required, retrieving coarse data and generating details as required. The generation process, as it stands in my head, would work something like this:
This is what I was experimenting with several months ago. A supercontinent land mass is created from a stochastically-generated polygon that is then split into continental plates that are shifted. I also experimented with some of the ideas from the Experilous web site but in raster form, as well as some techniques from Soon Tee Teoh's 2008 paper "River and Coastal Action in Automatic Terrain Generation". Only the continental shapes and plate data are required from my current experiment, for input to the next stage.
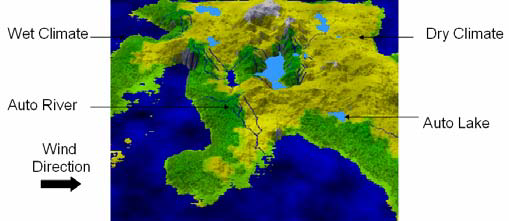
The Experilous planet generation techniques will be used to generate a coarse, vector-based three dimensional planet. The basis for the continental plates will come from the stage 1 output. A port of the Experilous code base from JavaScript to C# is required. The Experilous techniques result in elevation, temperature, moisture, and biome data, which will feed into the next stage. If fine details is not required, the output from this stage may be sufficient for biological or social simulation purposes.
Vectors for major mountain chains at colliding continental boundaries will be generated. The shape of the mountain chains will derive from the cellular structure from stage 2. The mountain chains can be rendered into detailed topography using techniques from Teoh, Houssam Hnaidi et al. ("Feature based terrain generation using diffusion equation"), Genevaux et al. ("Terrain Modeling from Feature Primitives"). The "erosive noise" / Swiss turbulence of de Carpentier and Bidarra ("Interactive GPU-based procedural heightfield brushes") could potentially be used here.
Techniques from Genevaux et al. ("Terrain generation using procedural models based on hydrology"), Teoh, or Amit Patel could be used here. Additional terrain generation may occur after/as part of the hydrology work.
More thoughts later. I may go see the new Star Wars movie and review it.
A potential compromise is generation of a coarse raster or vector map of the planet, with details provided procedurally and/or stored as vector data. Simulations can
work with the data as required, retrieving coarse data and generating details as required. The generation process, as it stands in my head, would work something like this:
Stage 1: Continental Shape Generation
 |
| Continental plates generated with my experimental code - send to stage 2! |
This is what I was experimenting with several months ago. A supercontinent land mass is created from a stochastically-generated polygon that is then split into continental plates that are shifted. I also experimented with some of the ideas from the Experilous web site but in raster form, as well as some techniques from Soon Tee Teoh's 2008 paper "River and Coastal Action in Automatic Terrain Generation". Only the continental shapes and plate data are required from my current experiment, for input to the next stage.
 |
| From Teoh "River and Coastal Action in Automatic Terra |
Stage 2: Planet Generation
The Experilous planet generation techniques will be used to generate a coarse, vector-based three dimensional planet. The basis for the continental plates will come from the stage 1 output. A port of the Experilous code base from JavaScript to C# is required. The Experilous techniques result in elevation, temperature, moisture, and biome data, which will feed into the next stage. If fine details is not required, the output from this stage may be sufficient for biological or social simulation purposes.
 |
| Screenshot of Experilous planet generator |
Stage 3: Mountain Generation
 |
| From Hnaidi et al. "Feature based terrain generation using diffusion equation" |
 |
| From de Carpentier and Bidarra "Interactive GPU-based procedural heightfield brushes" |
Stage 4: Hydrology Generation
 |
| From Genevaux et al. "Terrain generation using procedural models based on hydrology" |
Techniques from Genevaux et al. ("Terrain generation using procedural models based on hydrology"), Teoh, or Amit Patel could be used here. Additional terrain generation may occur after/as part of the hydrology work.
 |
| Example terrain generated from demo on Amit Patel's website |
What Comes After
Biological and sociocultural simulations could follow. This could lead to villages, towns, cities, and nations being formed. That would likely require at least some additional storage, although procedural techniques can again be used to help reduce the storage requirements. There's no need to retain extensive detailed geometry for every building in every city across the globe.More thoughts later. I may go see the new Star Wars movie and review it.
Wednesday, December 14, 2016
On the Road to Splines 5
There may be more this evening, but for now a few thoughts came up while I was eating lunch. Under the hood, so to speak, the set of parameters for spline-based terrain generation can be quite large. There can easily be tens of different parameters whose exact impacts may not be readily understandable when presented to a casual user in the GUI. The solution I've thought up is presets.
An excellent example of the presets concept, and my immediate source of inspiration, is Filter Forge, a 2D image effects program. The "filters" in Filter Forge are effects that can be applied to an image, and are built upon a node graph and/or code. They can have a large number of parameters. To simplify use a Presets list can be used that sets the parameters to values that are geared toward a particular end.
A similar concept fits the spline-based terrain concept very well. For example, mountain terrains will involve multiple parameters describing the general dimensions (width, height, slope, etc.), noise generation, and erosion. A simple set of presets for different mountain forms would make this much simpler. For example, the Canadian Rockies are more eroded than the more southerly Rocky Mountains, which are rougher than the Appalachians, which are more strongly oriented into parallel ridges than the Catskills. So there could be Canadian Rockies, Rocky Mountains, Appalachian, and Catskill presets.
Anyhow, enough blogging. I finished lunch and need to get back to work.
Well That's Different
According to articles online, a Dutch food truck is serving up horse burgers. I have no objections in principle to this, but I do think placing them on the menu as the My Little Pony Burger is a bit... mind-warping. That'd be like serving Soylent Green patties up as Barbie Burgers. I just hope they don't have a plastic taste.
Lost in Time
The past few days I've been a bit under the weather, and my sleep cycle is all messed up. I've been a bit too out of it to do much more than read fiction. Between what I'm reading, strange dreams, and the messed up sleep cycle, I feel a bit like I'm lost in time. I wake up and it takes a bit of effort to sort out when it is and what reality is like. Hopefully, I shall soon be able to get back to sleep and awake rested.
Until then, I present now a thematically-appropriate photo of a cake from the past. It was not my cake - but I did get to eat a piece of it. Dematerialization of the cake took a while, and did not involve strange sound effects.
Until then, I present now a thematically-appropriate photo of a cake from the past. It was not my cake - but I did get to eat a piece of it. Dematerialization of the cake took a while, and did not involve strange sound effects.
 |
| TARDIS cake served at Millennicon 30. |
Monday, December 12, 2016
Santa and Safety
A rather absurd image is making the rounds. Santa, reindeer, and sleigh are shown all kitted out with proper safety gear, such as a seat belt for Santa, non-slip safety shoes for reindeer, and bullet-proof vests to protect them against over-eager deer hunters. I love it! :)
(The image below may extend outside the main blog area. Sorry about that.)

(The image below may extend outside the main blog area. Sorry about that.)

Movie Review: Doctor Strange
I finally caught the latest Marvel film, Doctor Strange. This long-planned theater excursion was delayed by the Thanksgiving holiday, a birthday celebration for a friend, miscellaneous Christmastime fun - and the fact that my usual movie-going friends found the movie, er, strange. That is to say, they saw the trailer and like the slogan from the 1980's called for, they decided to "Just Say No." So I drove through the cold rain to watch it by myself this afternoon. (Afterwards, I walked the halls of the adjacent mall ran into a fannish friend as well as a retired co-worker. Small world.)
Anyhow, onto my impression. I enjoyed the movie, and felt it was well worth the eight dollars I spent. The plot maps fairly well to the classic "hero's journey" model, which seems only right for a superhero movie. I'll delve into details a bit more than I typically do with books, as there will be few spoilers for anybody who has seen the trailer.
The movie divides into roughly four parts, plus prologue and epilogue. The prologue introduces us very briefly to the villain of the piece, Kaecilius. In part one, our hero, the eponymous Doctor Stephen Strange, is introduced as a talented but arrogant neurosurgeon. We see a little of his life before a distracted-driving accident leaves his hands a shattered mess. Thus begins the second stage, in which he desperately seeks healing to resume his old life. This seeking leads him to the ends of the Earth. The third stage is his mystic training. The fourth, climactic part is when he is, at first unwillingly, drawn into the conflict with the villain Kaecilius. And finally there's the epilogue, consisting of a mid-credits scene and a post-credits scene. I'll not discuss the epilogue, other than to mention they're good, and you should watch to the end.
I think each of the parts works fairly well in and of itself. There's a good, if slow, build up of tension - and thanks to the prologue Kaecilius looms large over the whole story, even if he is totally absent for the first two parts and merely mentioned a few times in the third. About the only criticism I could level with respect to plot is that the fourth part, the renewed conflict with Kaecilius, feels a little bit rushed. There's a long, slow build up throughout the movie until the training ends and the conflict begins. The conflict feels slightly bit rushed by comparison. I don't think this is a major problem, but it seemed just slightly off to me.
The acting was fairly solid. The dialogue and characters seemed good, for the most part. There was a bit of cliche in a few spots, but it wasn't terrible. I think the actors did a good job portraying the characters, and the writing (cliches aside) had the characters acting in understandable (if not always wise) ways.
The visual effects were quite stunning, but I found myself slightly disoriented in certain scenes. When the world is being visually warped by mystic power such that it seems M. C. Escher was involved, it can be disconcerting. Still, the effects were excellent, even if they felt on the edge of overwhelming in a few places.
Lastly, there is the red cape. It is awesome.
The movie was good, but perhaps not quite great. I'd give it a B+ or a solid A, but not an A+. It was worth the price and I would definitely recommend watching it.
Saturday, December 10, 2016
The Color of the Land
The land has many colors. Reds, oranges, tans, whites, and greys tend to predominate in terms of rock colors. Which colors are most prevalent in a given location varies widely across the world, and even from one place to another within a given state. Similar land features in different areas can appear vastly different in color and shape.
For example, take the main features of Grand Teton and Capitol Reef National Parks. The Teton Range of the Rocky Mountains is the main geologic feature of Grand Teton, while the main geologic feature of Capitol Reef is the Waterpocket Fold. Both are relative narrow (east-west) but long (north-south) ranges formed from uplift.
When viewed in cross-section, average elevation in both follows a sawtooth shape, being quite asymmetrical; the crest of the Tetons is near the eastern edge of the range, with the crest of the Waterpocket Fold lies along the extreme western edge. As can be seen in the photographs accompanying this post, they look nothing alike. Partially, this is because the Tetons have been subjected to extensive glaciation, carving them into the jagged range you see today.
But color is another factor. The Tetons are largely in shades of gray (and white where the snow lingers) from the bedrock that composes them. Specifically, the rock of the Tetons is largely gray granite with some black diabase dikes.
The west face of the Waterpocket Fold appears as bands of tan, white, and red from its layers of sedimentary rocks. The sandstone is generally tan, but may be red if iron was present, while the limestone is the white band; a very pale, almost white, sandstone forms the uppermost layer here. The Waterpocket Fold is far older, originating with the Circle Cliffs Upwarp during the Laramide orogeny at least 35 million years ago, while the Tetons are only about 9 million years old. As sedimentary rock overlays bedrock, clearly mere age is not the reason for the difference.
The effects of glaciation can be emulated well enough via erosion algorithms. Colors, on the other hand, need another source. Some sort of virtual stratigraphy seems like the answer, but ideally it would involve neither large computational or storage requirements. Perhaps a fixed, one-dimensional table representing the stratigraphy, with a coarse map generated via Perlin noise indicating for a given point where in the stratigraphy table the local base elevation is to be found (with minor perturbation, perhaps?). I'm not sure yet, but it is definitely something to think upon.
 |
| Capitol Reef National Park, Utah |
For example, take the main features of Grand Teton and Capitol Reef National Parks. The Teton Range of the Rocky Mountains is the main geologic feature of Grand Teton, while the main geologic feature of Capitol Reef is the Waterpocket Fold. Both are relative narrow (east-west) but long (north-south) ranges formed from uplift.
 |
| Teton Range, Grand Teton National Park, Wyoming |
When viewed in cross-section, average elevation in both follows a sawtooth shape, being quite asymmetrical; the crest of the Tetons is near the eastern edge of the range, with the crest of the Waterpocket Fold lies along the extreme western edge. As can be seen in the photographs accompanying this post, they look nothing alike. Partially, this is because the Tetons have been subjected to extensive glaciation, carving them into the jagged range you see today.
 |
| Closer view of the Waterpocket Fold in Capitol Reef National Park |
The west face of the Waterpocket Fold appears as bands of tan, white, and red from its layers of sedimentary rocks. The sandstone is generally tan, but may be red if iron was present, while the limestone is the white band; a very pale, almost white, sandstone forms the uppermost layer here. The Waterpocket Fold is far older, originating with the Circle Cliffs Upwarp during the Laramide orogeny at least 35 million years ago, while the Tetons are only about 9 million years old. As sedimentary rock overlays bedrock, clearly mere age is not the reason for the difference.
The effects of glaciation can be emulated well enough via erosion algorithms. Colors, on the other hand, need another source. Some sort of virtual stratigraphy seems like the answer, but ideally it would involve neither large computational or storage requirements. Perhaps a fixed, one-dimensional table representing the stratigraphy, with a coarse map generated via Perlin noise indicating for a given point where in the stratigraphy table the local base elevation is to be found (with minor perturbation, perhaps?). I'm not sure yet, but it is definitely something to think upon.
Friday, December 9, 2016
On the Road to Splines 4
Yesterday I posted about the spline progress. I made only a little progress coding tonight, as I spent much of the evening out enjoying the Christmas lights. Still, I have made progress towards making the mountains work right. Elevation is computed by calculating distance from the center line of the spline outwards, and using simple linear interpolation between base elevation and elevation at the ridge line.
This is equivalent to the absolute simplest form of mountain generation by Soon Tee Teoh in his 2008 paper "River and Coastal Action in Automatic Terrain Generation." All points along the ridge line are of the same height. The rest of Teoh's ideas should be easy enough to incorporate, as should some of my own ideas.
However, much of that will have to wait. This application increasingly needs refactoring. For example, I think it needs to incorporate some limited level-of-detail (LOD) capability. At minimum, it needs a symbolic cartographic representation for when viewed zoomed out, and a detailed geometric representation when zoomed in. Also, there is that whole laundry list of items from my earlier post. Those also need to be addressed.
Beyond that, though, I have that town analysis I mentioned in a post yesterday that needs to continue. I'm putting together a small database to let me record detailed data collected from digital Sanborn maps. I'm interested in generating terrain, but I'd also like to be able to generate believable towns upon those terrains, as well.
For those curious about the underlying algorithm, I present the C# code snippet below. A segment of mountain is rendered to a height map using the code. This is the initial version of the code used for the mountain in the screenshot above. A mountain is defined by a spline that represents the ridge line of the mountain. The spline is segmented into individual line segments. Height declines linearly based upon a point's distance from the ridge line segment.
private void RenderLineSegment(Vector3 start, Vector3 end, float height1, float height2,
float slope, int offsetX, int offsetY, float[,] heights)
{
// Calculate the maximum distance the mountain may extend from
// the ridge line.
float maxExtent = (1 / slope) * Math.Max(height1, height2);
float maxExtentSq = maxExtent * maxExtent;
// Calculate the dimensions of this segment of mountain.
Vector3 min = Vector3.Min(start, end) -
new Vector3(maxExtent, maxExtent, 0);
Vector3 max = Vector3.Max(start, end) +
new Vector3(maxExtent, maxExtent, 0);
// Calculate segment length, and difference in height between
// start and end points.
LineSegment seg = new LineSegment(start, end);
float segLength = Vector3.Distance(start, end);
float deltaH = height2 - height1;
// Render the height (elevation) data.
for (float y = min.Y; y < max.Y; y++)
{
for (float x = min.X; x < max.X; x++)
{
Vector3 curr = new Vector3(x, y, 0);
Vector3 nearest = seg.NearestPointOnSegment(curr);
float distSq = Vector3.DistanceSquared(curr, nearest);
if (distSq <= maxExtentSq)
{
// linear interpolate height at point on segment.
float ndist = Vector3.Distance(nearest, start);
float nPercent = ndist / segLength;
float h = height1 + (deltaH * nPercent);
// linear interpolate height at current point.
float extent = (1 / slope) * h;
float currPercent = 1 - ((float)Math.Sqrt(distSq) / extent);
float currH = currPercent * h;
// set elevation only if greater than elevation already
// present at point.
int gridX = (int)x + offsetX;
int gridY = (int)y + offsetY;
heights[gridX, gridY] = Math.Max(heights[gridX, gridY], currH);
}
}
}
}
 |
| Mountain spline is now colored to represent elevation. Note lighter color along ridge line. |
This is equivalent to the absolute simplest form of mountain generation by Soon Tee Teoh in his 2008 paper "River and Coastal Action in Automatic Terrain Generation." All points along the ridge line are of the same height. The rest of Teoh's ideas should be easy enough to incorporate, as should some of my own ideas.
However, much of that will have to wait. This application increasingly needs refactoring. For example, I think it needs to incorporate some limited level-of-detail (LOD) capability. At minimum, it needs a symbolic cartographic representation for when viewed zoomed out, and a detailed geometric representation when zoomed in. Also, there is that whole laundry list of items from my earlier post. Those also need to be addressed.
Beyond that, though, I have that town analysis I mentioned in a post yesterday that needs to continue. I'm putting together a small database to let me record detailed data collected from digital Sanborn maps. I'm interested in generating terrain, but I'd also like to be able to generate believable towns upon those terrains, as well.
For those curious about the underlying algorithm, I present the C# code snippet below. A segment of mountain is rendered to a height map using the code. This is the initial version of the code used for the mountain in the screenshot above. A mountain is defined by a spline that represents the ridge line of the mountain. The spline is segmented into individual line segments. Height declines linearly based upon a point's distance from the ridge line segment.
private void RenderLineSegment(Vector3 start, Vector3 end, float height1, float height2,
float slope, int offsetX, int offsetY, float[,] heights)
{
// Calculate the maximum distance the mountain may extend from
// the ridge line.
float maxExtent = (1 / slope) * Math.Max(height1, height2);
float maxExtentSq = maxExtent * maxExtent;
// Calculate the dimensions of this segment of mountain.
Vector3 min = Vector3.Min(start, end) -
new Vector3(maxExtent, maxExtent, 0);
Vector3 max = Vector3.Max(start, end) +
new Vector3(maxExtent, maxExtent, 0);
// Calculate segment length, and difference in height between
// start and end points.
LineSegment seg = new LineSegment(start, end);
float segLength = Vector3.Distance(start, end);
float deltaH = height2 - height1;
// Render the height (elevation) data.
for (float y = min.Y; y < max.Y; y++)
{
for (float x = min.X; x < max.X; x++)
{
Vector3 curr = new Vector3(x, y, 0);
Vector3 nearest = seg.NearestPointOnSegment(curr);
float distSq = Vector3.DistanceSquared(curr, nearest);
if (distSq <= maxExtentSq)
{
// linear interpolate height at point on segment.
float ndist = Vector3.Distance(nearest, start);
float nPercent = ndist / segLength;
float h = height1 + (deltaH * nPercent);
// linear interpolate height at current point.
float extent = (1 / slope) * h;
float currPercent = 1 - ((float)Math.Sqrt(distSq) / extent);
float currH = currPercent * h;
// set elevation only if greater than elevation already
// present at point.
int gridX = (int)x + offsetX;
int gridY = (int)y + offsetY;
heights[gridX, gridY] = Math.Max(heights[gridX, gridY], currH);
}
}
}
}
A Glimpse into the Past: Sanborn Fire Insurance Maps
As I've mentioned previously, I've been making observations about traditional American towns. I am presently trying to better quantify and systematize the data. One important source of data are Sanborn Fire Insurance Maps. The Sanborn company produced maps detailed fire insurance maps of towns and cities across America for over a century. These maps indicate the buildings in towns, their construction, number of stories, etc. and include roads and conventional railroads (streetcars and electric interurbans are rarely mapped). The detail they provide helps offer a glimpse into the American past.
A number of additional fire-relevant details are also provided on the maps, as understanding fire risk and fire fighting capabilities was their primary purpose. Note the water pipes and their diameters shown on the portion of a map shown below. The black circle with a D.H. above it indicates a double fire hydrant. Toward the bottom is a symbol with the letters F.E. next to it, indicating a fire escape. More detailed information was provided for industrial facilities and fire stations.
In the portion of map shown, the Great Northern Glove Manufacturing Company occupies the second floor of the structure. If you look closely, you'll notice that it includes the information that the facility is heated by stove and that power and lights are provided by electricity.
This wasn't always the case. Some small factories and machine shops in the early 20th century relied upon gasoline engines to power equipment. In some cases you'll find this noted, including the size of the gas tank(s) in use - but not on this particular bit of map.
It can take some additional information to help decode the maps. The maps employed a set of abbreviations for various features and their aspects. For example, the "Bl. Sm." in the yellow rectangle at bottom right indicates the building is occupied by a blacksmith, while the parenthetical "C. B." on the blue rectangles toward the top indicate concrete block construction. The number of stories for each building is shown by a somewhat large number in a corner of the building; if a B suffix is present it means there's a basement. The height in feet is usually shown as well.
The colors of the building as depicted on the map are also important. They help denote the construction of the building. The Library of Congress has a nice scan of one such key available. Short version: yellow is frame (wood) construction, pink is brick construction, blue is stone or concrete, and gray is metal - although a shade of gray is also used for adobe. There are various combinations that indicated combinations of materials, and abbreviations that modify, so a careful look at the key is called for.
So how can you look at these maps? Digital copies of the maps for a state are usually available free online from a state library and/or university. What's the catch? Oftentimes you can only access them from within that state, or with institutional credentials (library or university) from that state. Partially this is due to copyright. The ones from 1923 or later are still under copyright, but the ones from 1922 and earlier are in the public domain and may be made freely accessible. Partially this is due to budget reasons: its costs money to host and stream the maps.
Indiana University and Penn State University have their respective states' pre-1923 Sanborn maps freely available online, but later ones are only available to in-state users. They're in color. The Sanborn maps for Ohio are freely available to Ohioans, but not out-of-state - and they're only in black and white. New Jersey, Illinois, and Iowa seem to be in a similar situation to Ohio, but in color.
The Library of Congress has their digital collection of Sanborn maps accessible to all - but only a tiny fraction of their physical Sanborn map holdings have been digitized. For example, for New Jersey, only about a dozen cities and towns whose name start with "B" are available digitally - the rest of the alphabet need not apply. For Iowa, a small portion of the cities and towns whose names begin with "D" or "E" are available digitally. For some states, no digital Sanborn maps are available from the Library of Congress.
There's also a complete digital collection maintained by ProQuest. Alas, many institutions don't purchase access. Invidual access is pricey.
Despite some difficulty gaining full access to the maps, they can be quite useful for learning about the past of towns and cities of America. Data derived from the maps can be useful in many contexts. It can answer questions about urban growth, patterns of development, mix of stores, and other social, geographic and historic matters.
Alas, as I mentioned above, one are of personal interest where they've proven to be of little help is with respect to streetcars and electric interurban railways. Mostly, the map makers omitted them, unless they were conversions of steam railroads, or also used steam locomotives regularly. If they included them otherwise, it appears to have been by lucky coincidence. Stations and other facilities are generally shown, but the tracks themselves are not.
So, to conclude, the digital Sanborn maps offer a useful glimpse into the past. You can probably obtain easy access to your state's collection. Obtaining free access to those for other states may be trickier, but you may be lucky.
A number of additional fire-relevant details are also provided on the maps, as understanding fire risk and fire fighting capabilities was their primary purpose. Note the water pipes and their diameters shown on the portion of a map shown below. The black circle with a D.H. above it indicates a double fire hydrant. Toward the bottom is a symbol with the letters F.E. next to it, indicating a fire escape. More detailed information was provided for industrial facilities and fire stations.
In the portion of map shown, the Great Northern Glove Manufacturing Company occupies the second floor of the structure. If you look closely, you'll notice that it includes the information that the facility is heated by stove and that power and lights are provided by electricity.
This wasn't always the case. Some small factories and machine shops in the early 20th century relied upon gasoline engines to power equipment. In some cases you'll find this noted, including the size of the gas tank(s) in use - but not on this particular bit of map.
 |
| From the 1919 Sanborn map of Bluffton, Indiana |
The colors of the building as depicted on the map are also important. They help denote the construction of the building. The Library of Congress has a nice scan of one such key available. Short version: yellow is frame (wood) construction, pink is brick construction, blue is stone or concrete, and gray is metal - although a shade of gray is also used for adobe. There are various combinations that indicated combinations of materials, and abbreviations that modify, so a careful look at the key is called for.
So how can you look at these maps? Digital copies of the maps for a state are usually available free online from a state library and/or university. What's the catch? Oftentimes you can only access them from within that state, or with institutional credentials (library or university) from that state. Partially this is due to copyright. The ones from 1923 or later are still under copyright, but the ones from 1922 and earlier are in the public domain and may be made freely accessible. Partially this is due to budget reasons: its costs money to host and stream the maps.
Indiana University and Penn State University have their respective states' pre-1923 Sanborn maps freely available online, but later ones are only available to in-state users. They're in color. The Sanborn maps for Ohio are freely available to Ohioans, but not out-of-state - and they're only in black and white. New Jersey, Illinois, and Iowa seem to be in a similar situation to Ohio, but in color.
The Library of Congress has their digital collection of Sanborn maps accessible to all - but only a tiny fraction of their physical Sanborn map holdings have been digitized. For example, for New Jersey, only about a dozen cities and towns whose name start with "B" are available digitally - the rest of the alphabet need not apply. For Iowa, a small portion of the cities and towns whose names begin with "D" or "E" are available digitally. For some states, no digital Sanborn maps are available from the Library of Congress.
There's also a complete digital collection maintained by ProQuest. Alas, many institutions don't purchase access. Invidual access is pricey.
Despite some difficulty gaining full access to the maps, they can be quite useful for learning about the past of towns and cities of America. Data derived from the maps can be useful in many contexts. It can answer questions about urban growth, patterns of development, mix of stores, and other social, geographic and historic matters.
Alas, as I mentioned above, one are of personal interest where they've proven to be of little help is with respect to streetcars and electric interurban railways. Mostly, the map makers omitted them, unless they were conversions of steam railroads, or also used steam locomotives regularly. If they included them otherwise, it appears to have been by lucky coincidence. Stations and other facilities are generally shown, but the tracks themselves are not.
So, to conclude, the digital Sanborn maps offer a useful glimpse into the past. You can probably obtain easy access to your state's collection. Obtaining free access to those for other states may be trickier, but you may be lucky.
Thursday, December 8, 2016
On the Road to Splines 3
I continued work on splines a little bit at a time over the past few days. The results aren't perfect, but can at least be shown. Instead of mere thin black lines, we now have roads and railroads.
As you can see from the screenshot below, there are a few areas that need to be addressed. The left-most roads were drawn using the polyline tool. You can see the problems at the corners. Less obvious are the smaller artifacts along the spline. These need to be addressed to get a smooth shape.
The other big areas that obviously need to be addressed are the intersections and crossings. Where roads intersect other roads, or tracks intersect other tracks, additional rendering logic is required. Where roads and tracks cross, there is also the need for more rendering logic. At the moment, all they do is overlap.
Related to the last paragraph is the current total lack of any topological representation. Each line segment, polyline, spline, or polygon is essentially independent of all others. A graph structure for each type is required to add some semblance of order and contribute to improves in the areas mentioned above.
Just a quick note about current rendering. The example application is implemented in C# and Windows Forms, with the graphics being rendered using GDI+. That's not necessarily the long-term solution, as I hope to integrate this code with the 3D stuff I've also posted about here. It may work well enough for basic editing operations, though - in which case I need some zooming and panning controls, as well as the ability to load and save what has been drawn.
I'll post more on this when there's been more progress worth sharing.
As you can see from the screenshot below, there are a few areas that need to be addressed. The left-most roads were drawn using the polyline tool. You can see the problems at the corners. Less obvious are the smaller artifacts along the spline. These need to be addressed to get a smooth shape.
 |
| Railroads and roads drawn using lines, polylines, and splines |
The other big areas that obviously need to be addressed are the intersections and crossings. Where roads intersect other roads, or tracks intersect other tracks, additional rendering logic is required. Where roads and tracks cross, there is also the need for more rendering logic. At the moment, all they do is overlap.
Related to the last paragraph is the current total lack of any topological representation. Each line segment, polyline, spline, or polygon is essentially independent of all others. A graph structure for each type is required to add some semblance of order and contribute to improves in the areas mentioned above.
 |
| Road, railroad, river, and a trio of buildings |
Just a quick note about current rendering. The example application is implemented in C# and Windows Forms, with the graphics being rendered using GDI+. That's not necessarily the long-term solution, as I hope to integrate this code with the 3D stuff I've also posted about here. It may work well enough for basic editing operations, though - in which case I need some zooming and panning controls, as well as the ability to load and save what has been drawn.
I'll post more on this when there's been more progress worth sharing.
Wednesday, December 7, 2016
Some Observations on Towns
Why make observations about towns? Because the world is full of them, and if I wish to simulate them, I need to know a bit more about them. To date, 3D modeling of cities has largely focused on major urban areas, trying to replicate cities such as New York City, Paris, San Francisco, etc. Only two papers I'm aware of address other types of population centers: there is one paper villages and one on South African informal settlements. So before I ever attempt to address simulating them, I need to make some observations. A brief literature search revealed little; most works seem to be on major historical or modern cities, or planning new communities. I've found virtually nothing on American towns.
What is a town? For purposes of discussion, we shall label as a town as any population center with a population of several hundred to several thousands, and that has a concentrated commercial district with more than eight commercial structures. A grocery store, a gas station, a post office, a bar, and a few dozen houses do not constitute a town, but a village. For this discussion in particular, a traditional town is one whose commercial district predates the mass adoption of the automobile - let us use the date 1930 for the sake of this discussion. In this discussion, we shall primarily focus on traditional American towns, in particular their shape.
The overall shape, as in the outline of the town, tends to be vary from compact rectangle to amorphous blob. Sometimes, the main mass of the town extends further out along the roads connecting the town to others, and so appears to have tendril-like growths extending from it. But that's not the shape I'm really referring to. Perhaps layout, arrangement, or plan would be better terms. For example, the shape of the commercial district and the industrial district, and their positions relative to one another, do much to determine the appearance of a town. The commercial district seems to take three main forms. I refer to them as linear, intersection, and cluster.
With a linear commerical district, commercial buildings face a single street along one or both sides of the street. Many times, the street in question bears the name Main, Market, Broad, High, or Commercial. That street may or may not be the main thoroughfare through town. In some cases, the street lays perpendicular to the main thoroughfare. When it is perpendicular, the commercial district may be split by the main thoroughfare, or it may be adjacent.
In an intersection form, the commercial district runs along intersecting streets, often taking a "t" shape, but sometimes a "y" or "k" in towns where the streets take a less grid-like form. The "y" and "k" shapes seem more common in towns that are East of the Appalachian Mountains, with a "t" shape is more common elsewhere in America, but all of the patterns can be seen throughout the nation. It is not uncommon for the street names mentioned above to be applied to the streets in question. As with linear, in the intersection form the streets involved may be the main thoroughfare or not.
The third form I refer to as cluster. The cluster form consists of multiple blocks of commercial buildings clusterered together. In a town, this seldom exceeds an area of six blocks by six blocks, and is often far less. It may be square, rectangular, or somewhat irregular. Sometimes the commercial district will include a central square that contains a park, courthouse, and/or town hall. In such cases, the central square is often faced by commercial buildings on all facing half-blocks; in some cases, that is the entire extent of the commercial district.
An industrial district usually runs parallel to railroad tracks, or in older mill towns, along the banks of canals or mill races, where water power could be obtained. The industrial district is seldom very wide but may run for an extended distance along the railroad tracks or mill race. If there are multiple railroads or power canals, there may be multiple industrial districts. This is especially common in cases where one railroad runs east-west and another north-south.
In cases where the town and the railroad where built at roughly the same time, or the town was very small when the railroad arrived, the commercial district is often adjacent to the industrial district near the railroad. If the town came first, and grew a bit, the railroad often passed by the edge of town rather than purchasing or condemning the property necessary to get near the commercial district. In such cases, several blocks of residences may separate the commercial and industrial districts.
And thats all for now. These are preliminary observations, and I'm still gathering data and organizing it. Once I've collected and tabulated more data I shall follow up this initial information and quantify things a bit. Some decent examples and statistics would be nice to share.
Subscribe to:
Posts (Atom)